3D_Optolab_1.jpg

3D-Optolab: optical digitization based on active triangulation and non-coherent light projection

As shown in Fig. 1, the system is composed by the optical head and two moving stages. The optical head exploits active stereo vision. The projection device, LCD based, projects on the target object bi-dimensional patterns of non-coherent light suitable to implement the SGM, PSM GCM and GCPS techniques for light coding. Each point cloud is expressed in the reference system of the optical head (XM, YM, ZM).

The optical head is mounted on a moving stage, allowing its translation along the vertical and the horizontal directions (Tv, To); as shown in Fig. 2, areas large up to two square meters can be scanned and large surfaces can be measured by acquiring and aligning a number of separate patches. The objects presenting circular symmetry can be placed on a rotation stage: it enables the acquisition of views at different values of the rotation angle.

The system is equipped with stepped motors, to fully control the rotation and the translation of the optical head. Each view is aligned by means of rototraslation matrices in the coordinate system (XR, YR, ZR), centerd on the rotation stage. The sequence of acquisition of the range images is decided on the basis of the dimension and the shape of the object, and is performed automatically.

Fast calibration is provided, both for the optical head and for the rotation stage.

3D_Optolab_1.jpg
Fig. 1 - Schematization and image of the prototype.
Fig. 2 - Example of acquisitions of a large object (top) and a smaller one (bottom).

System Performances

  • Optical, non contact digitization based on active triangulation and non-coherent light projection;
  • Adjustable measuring area, from 100 x 100 mm to 400 x 400 mm (single view);
  •  Measuring error from 0.07 mm to 0.2 mm, scaled with the Field of View;
  • Automatic scanning, alignment and merging, mechanically controlled;
  • Color/texture acquisition;
  • PC based system, with 333 Pentium II, Windows 98 and Visual C++ software
  • Import/Export formats for CAD, rapid prototyping, 3D-viewers, graphic platforms;
  • Software interface for the handling, the processing and the visualization of both partial and complete point clouds.
OPL-3D_1.jpg

OPL-3D: a portable system for point cloud acquisition

OPL-3D has been specifically designed for applications of reverse engineering and rapid prototyping, as well as for applications of measurement and quality control.

The system exploits active stereo vision (the absolute approach is implemented) using time-multiplexing based on the Gray-Code-Phase-Shifting method.

The projector-camera pair

OPL-3D can host a wide variety of projectors. In the left figure in Fig. 1 the device is the ABW LCD 320: it is a microprocessor-controlled and column-driven projector, specifically intended to be used in this class of systems. Alternatively, those devices currently available for video projection can be succesfully used, as that one shown on the right figure in Fig. 1 (Kodak DP 900, based on DLP technology).

The detector is a commercial CCD video camera. In the configurations shown in Fig. 1, the camera is an inexpensive colour Hitachi KP D50, with standard resolution (752 x 582 px). However, any type of camera (black/white or colour, with single or multiple CCDs for colour separation, and with different pixel densities) can be mounted on the system, depending on the application and on the projector used. In Fig. 2, for example, a 1300 x 1030 px digital video camera (Basler model) is mounted, to acquire at the required resolution large fields of views

The mount

The projector and the camera are mounted onto a rigid bar, that can be easily moved around the scene by means of a tripod, and that holds the adjustment units for proper orientation. The mount is fully reconfigurable: all parameters can be varied according to the distance from the target, the required measurement resolution and the FoV (Fig. 3).

Given the fact that through sophisticated calibration procedures the system is able to finely estimate the operating parameters, no accurate positioning equipment (micropositioners, microrotators) is required, the only requirement being stability of the mount during the measurement procedure.

Fig. 4 shows two examples of on-site measurements of complex shapes where the full flexibility of the system was mandatory to perform the acquisition.

Fig. 3 - Images of the tripods used and of the equipment of the prototype.
Fig. 4 - Two on-site acquisition campaigns carried out by the Laboratory: the Winged Victory point cloud acquisition (left) and the Ferrari point cloud acquisition (right).

The electronic hardware

OPL-3D is equipped with a PC, that has the purpose of (i) driving the projector with the appropriate pattern sequence, (ii) acquiring the image sequences from the target, and (iii) elaborating the images. In addition, it contains all the features to perform sophisticated procedures for setting up and reconfiguration.

The PC is in the current configuration a Pentium III 900 MHz, 1 GB Ram, equipped with a Matrox Meteor II Frame Grabber. The Projector is operated by the PC through the Serial Connector.

PERFORMANCE

OPL-3D exhibits low-measurement uncertainty (120 mm) over large measurement areas (450 x 340 mm), linearly scalable in the case of smaller areas. Special care has been devoted to flexibility of use, in-field measurement setting, reconfigurability and robustness against environmental light changes and surface colour and texture

Fig. 5 shows the acquisition of the blue car already seen in Fig. 2. Multiview alignment and registration is performed by either purposely designed software or by means of commercially available products, depending on the complexity of the process.

Fig. 5 - Point Cloud obtained with every acquisition aligned to form a complete and dense reconstruction.

Technology transfer

OPL 3-D has been put into the market by Open Technologies s.r.l., Italy, a start-up company of the University of Brescia, under the Trade Name of 3DShape, in a manifold of versions, including sophisticated software for multi-view combination, point cloud manipulation and transformation, up to surface generation.

OptoSurfacer: an optical digitizer for reverse engineering of free-form surfaces

What is OptoSurfacer?

The purpose of this activity is the development of descriptive 3D models of the point clouds acquired by the optical digitisers developed at the Laboratory, for the implementation of the Reverse Engineering of complex shapes and in applications that priviledge the efficiency of the whole process with respect to its accuracy.

Typical fields are the production of prototypes and moulds within the collaborative design process and for copying applications, the restitution of cultural heritage, and the Virtual Reality.

The objective is also the implementation of an alternative path with respect to the traditional CAD-based process, to allow the user to model the physical shapes by means of meshes of simple geometrical elements, without requiring specialised knowledge and background, and at the same time providing total compatibility with the higher performance, higher cost, market available software environments, dedicated to CAD and copying applications.

The activity resulted in the development of a software tool called OptoSurfacer, with the following characteristics:

  1. importing and ordering of dense and sparse point clouds, optically acquired;
  2. detection and editing of undercuts and outlayers;
  3. scalingmirroring and translation of the entities;
  4. automatic definition of the meshes that model the original measurement data;
  5. flexible trimmering of the mesh topology depending on the object local curvature;
  6. coding of the models in the IGES format to guarantee their usability in the CAD and CAM environments market available.

HOW TO OBTAIN THE MESHES?

The flow-chart in Fig. 1 describes the tasks performed by OptoSurfacer. They are illustrated for the study case of the object shown in Fig. 2 (a roof tile). The corresponding point cloud, shown in Fig. 3 has been acquired by means of the prototype DFGM (see the Prototypes page), and is characterised by a variability of the measurement of about 200 microns.

Fig. 3 - Corresponding point cloud of the roof tile obtained by means of the prototype DFGM.

OptoSurfacer automatically performs the ordering of the points by creating a regular reference grid and by using the surface shown in Fig. 4 as the basic geometrical element of the mesh. For the roof tile, the shapes have been modelled as shown in Fig. 5, and the resulting mesh is presented in Fig. 6. The irregularities well observable in this figure mainly depend on the roughness and the porosity of the material.

Fig. 4 - Basic geometrical element of the mesh.
Fig. 5 - Reference model to model the roof tile.
Fig. 6 - Resulting mesh of the roof tile obtained.

The solid model of the object has been obtained from the mesh representation of Fig. 6. OptoSurfacer generated the sections presented in Fig. 7 and, by blending them, the mathematics of the object. The final solid model is shown in Fig. 8: it is saved in the IGES format, and presents full compatibility with a wide number of CAD-CAM products market available.

Relevant Publications

Sansoni, G.; Docchio, F. “In-field performance of an optical digitizer for the reverse engineering of free-form surfaces“, The International Journal of Advanced Manufacturing Technology, Vol. 26, no. 11–12, pp. 1353–1361. 2005

OPL_Align: a software for point cloud alignment

OPL_Align is used to increase the quality of the alignment, especially in the case of very accurate point clouds that the performance of View-Integrator cannot align at the measurement accuracy. Also in this case, a pair-wise matching is used, based on the Iterative Closest Point approach. Fig. 1 shows an example of the performance of this tool.

The bass-rilief of Fig. 1 is chosen as the test object. The two partial views in the frames are shown in the OPL_Align environment in Fig. 2, where it is also evidenced the common region used to perform the alignment. The top figure in Fig. 3 shows the relative position between the two patches (Vista 1 and Vista 2 respectively) is shown before and after the alignment. The bottom figure in Fig. 3 shows the performance of the alignment.

Fig. 3 - Relative position between the two patches (top), performances of alignment (bottom).

View_Integrator: an interactive way to align point cloud views

View_Integrator exploits the correspondence between fiduciary points (markers) in different adjacent views. The procedure requires that the user interactively selects corresponding markers in the views to be aligned. Then it estimates with sub-pixel accuracy the 3D position of the centres of each marker and minimizes the sum of all the distances between the estimated centres until a preset threshold is reached. The surface shape suggests the typology of the markers used to determine the coordinates of the fiduciary points.

Placement of ‘hard’ markers

In some cases, markers of circular shape are physically placed on the surface. This approach has the advantage that we can freely move the object with respect to the optical head, acquire all the views needed to completely acquire it, with the only constraint that the overlapping regions contain the same set of markers. However, the markers are still present on the range information, inducing additional noise. Fig. 1 and Fig. 2 illustrate this experimental case. The object under test is a mannequin head. Fig. 1 shows the marker selection; Fig. 2 presents the corresponding 3D range images and their alignment.

Fig. 1 - Marker selection on the mannequin head.
Fig. 2 - Alignment of the two views.

Placement of “soft markers”

As shown in Fig. 3, we can turn off the projection of the markers during the measurement, and turn it on for the acquisition of the color/texture information. In this way, the markers do not disturb the surface, and the alignment can be performed more accurately.
Fig. 4 illustrates the View-Integrator interface during the selection of the markers, and the result of the alignment is presented in Fig. 5.

Fig. 5 - Result of the alignment of different views in a completed mesh.

Feature based selection of the markers

The last set of figures illustrate how the alignement of the views is performed in the case that neither “hard” nor “soft” markers are used. In this situation, the selection of the fiduciary points is based on the choice of corresponding features in the images; however, this task is very time consuming and critical for the operator, especially when the number of partial views to be aligned is high and when the color information superimposed to the range does not help the operator, as is the case of the two views shown in Fig. 6.

Our approach to solve this problem is the elaboration of the range information by means of the Canny edge detector. As shown in Fig. 7, the 3D images present significant edges that are well enhanced by the filter and dramatically simplify the operator work. Fig. 8 shows the effect of the Canny edge detector and Fig. 9 the matching between the views.

Fig. 6 - Dense views of a bas-relief.
Fig. 7 - The edges of the views are quite significant and can be used to enhance the alignment.
nuvola OPL_viewer.jpg

OPL_Viewer: useful tool to visualize point clouds

This module has been developed to visualize the point clouds.

The main features of the tool are:

  1. visualization by means of regular grids;
  2. availability of basic functions as rotationtranslation and scaling of the point clouds;
  3. variable setting of the sampling step (i.e., of the resolution);
  4. visualization of the colour information;
  5. setting of the parameters of the visualization (grid colour, frame colour, point dimension, point colour, ecc.);
  6. multi-document environment, for the visualization of different views of the same point cloud and/or different point clouds;
  7. filtering of isolated points (outlayers);
  8. editing of groups of points;
  9. compatibility with the ROT (rotate), the OPL (Optolab), the OPT (Open Technologies s.r.l) and PIF (InnovMetric Inc.) file formats;
  10. availability of an interactive, user friendly working environment, developed on the OpenGL library.

Fig. 1 shows an example of the facilities available in the module. The same point cloud is visualized in two independent windows, at different resolution, with the colour information (left view) and representing the only range information (right view). The visualization of multiple views is presented in Fig. 2.

Fig. 1 - Visualization of the same point cloud in two independant windows.
Fig. 2 - Visualization of multiple views.

The BARMAN project

The aim of this project is to add 2D vision to the BARMAN demonstrator shown in Fig. 1. The BARMAN is composed of two DENSO robots. In its basic release it picks up bottles, uncorks them and places them on the rotating table. It then rotates the table, so that people can pick them up and drink.

The tasks of the Barman are summarized here:

  1. to survey the foreground and check if empty glasses are present;
  2. to rotate the table and move glasses to the background;
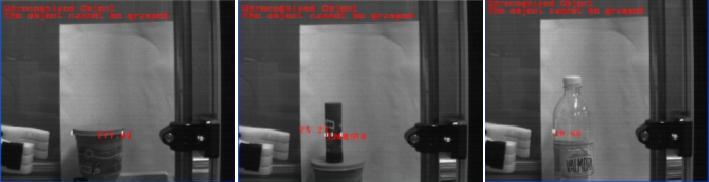
  3. to monitor for a bottle on the conveyor, recognize it, pick it up, uncork it and fill the glasses;
  4. to rotate the table to move glasses to the foreground zone.

These simple operations require that suitable image processing is developed and validated. The software environment is the Halcon Library 9.0; the whole-project is deveoped in VB2005. The robot platform is the ORiN 2 (from DENSO).

The work performed so far implements the following basic functions described below.

Calibration of BOTH cameras and robot

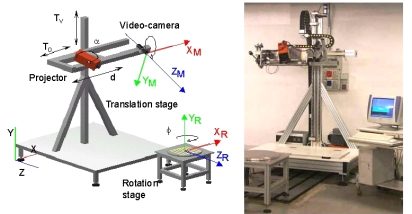
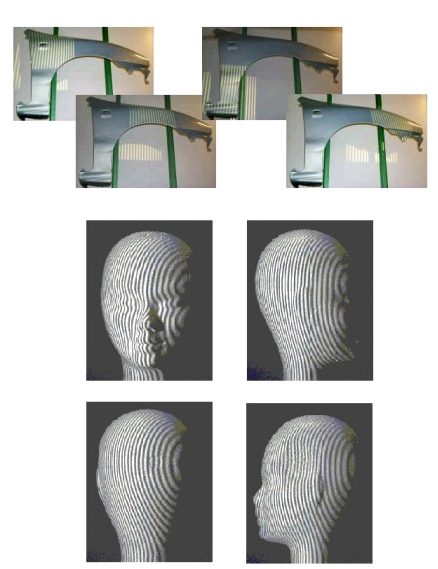
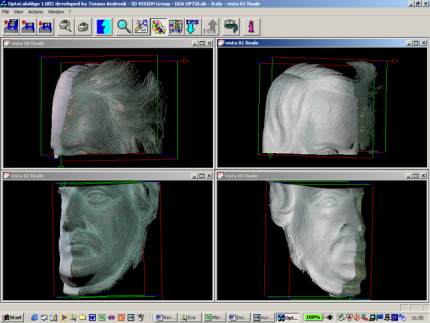
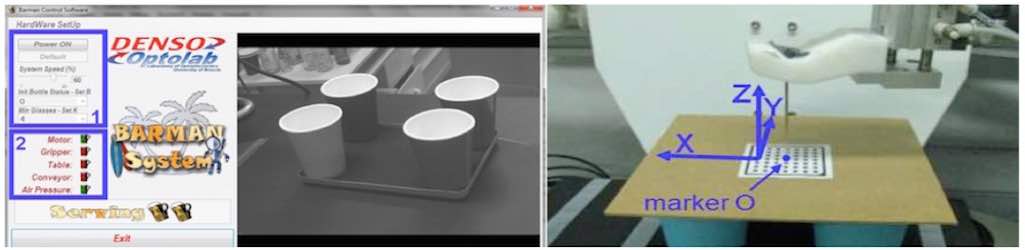
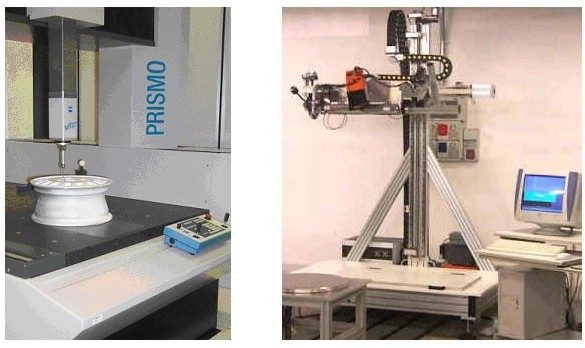
The aim is to define an absolute reference system for space point coordinates, where the camera coordinates can be mapped to the robot coordinates and viceversa. To perform this task a predefined master is used acquired under different perspectives (see Fig. 1 and Fig. 2 ).

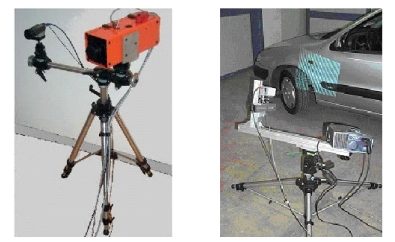
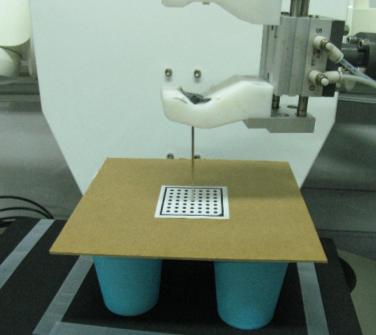
The acquired images are elaborated by the Halcon calibration functions, and both extrinsic and intrinsic camera parameters are estimated. In parallel, special procedures for robot calibration have been reproduced and combined with the parameters estimated for the cameras (Fig 3).

Fig. 1 - Acquisition of the master in correspondence with the background zone (left); corresponding image in the Halcon environment (right).
Fig. 2 - Images of the master before (left) and after (right) the elaboration.
master_robot.JPG
Fig. 3 - Calibration process of the robot.

Detection of empty glasses in the foreground

Flexible detection has been implemented to monitor the number of empty glasses. In addition, some special cases have been taken into account. Some exaples are shown in the following images (Fig. 4 and Fig. 5).

Fig. 4 - Detection of a single glass (left); detection of three glasses (right).
Fig. 5 - Detection of four glasses very close to each other (left); detection in the presence of glasses turned upside down.

Detection of glasses in the background

The position of the glasses in the background are calculated very precisely, since the camera is calibrated. In addition, it is possible to recognize semi-empty glasses and glasses turned upside down. This detection is mandatory to guarantee that the filling operation is performed correctly. Fig. 6 shows some significant examples.

Fig. 6 - Detection of the position of the glasses in the background. The system detects the presence of semi-empty glasses (center image) and turned glasses and do not mark them as available for subsequent operations.

Bottle detection

Three different types of bottles are recognized as “good” bottles by the system. The system is able to detect any other object which does not match the cases described above. It can recognize either if the “unknown” object can be picked up and disposed by the Barman, or if it must be removed manually.

bottle_detection_NOK.JPG
Fig. 8 - Detection of unmatched objects.

Filling of the glasses

The robot is moved to the positions detected by the camera (see Fig. 6), and fills the glasses. Since both the cameras and the robots share the same reference system, this operation is “safe”: the robot knows where the glasses are.

Fig. 9 - Filling operation.

RAI Optolab Interview TG Neapolis 12/05/2010

zeiss.jpg

To learn more on the combined use of CMMs with optical probes

The 3D Vision system used during the experimentation was the prototype 3D-Optolab, and the CMM was the Zeiss Prismo Vast 7D, equipped with the software Holos, installed at the DIMEG Metrological Laboratory. Both are shown in Fig. 1.

The proposed methodology does not foresee the physical integration of the two sensors; instead, their combination at the level of the measurement information is carried out, in a module for the intelligent aggregation of the information coming from the sensors.

Fig. 1 - The Zeiss Prismo Vast 7D (left) and the 3D-Optolab prototype (right) used for the project.

Fig. 2 schematically presents the method. The starting point is the acquisition of a number of clouds of points using 3D-Optolab. These are then imported into the CAD environment PRO/ENGINEER. The initial “rough” CAD model of the surface is obtained by using the modules available in the CAD environment PRO/E. This model is used to “feed” the CMM in the contact, accurate digitization step. The a-prori knowledge of a “rough” description of the surface allows an efficient programming of the scanning and digitizing path, and reduces the number of touch points and of the iterations needed to achieve the complete digitization of the object. The methods was tested on a number of objects: the experimental results are presented and discussed in the related publications at the bottom of the page.

Fig. 2 - Scheme of the developed procedure.

This research activity has been further developed in the frame of the project “Development of a novel methodology for the reverse engineering of complex, free-form surfaces, combining three-dimensional vision systems and Coordinate Measuring Machines” funded by the Italian Ministry of Research, in the year 2000. Two further Laboratories participate to this project: the DIMEG Metrological Laboratory, University of Padova, and the 3D Vision Group located at the Dipartimento di Elettronica e Informatica of the Milan Polytechnic. The objectives of this work are well described by the scheme in Fig. 3.

Fig. 3 - Objectives of the research work in a work-flow fashion.

Optical RE

The first aim of the project, (“Optical RE” in the Fig. 3) is to optimize the RE process as far as the time of execution, by creating a 3D model for the description of the object under test by using the optical digitization. This objective has been performed in the following steps:
  1. development of a reliable and easy to use optical digitizer, able to generate 3D point clouds that describe various parts of the object, each from a specific viewpoint; the measurement system, should be easily movable in space, in order to be able to “observe” the target object from different perspectives, and to create a set of point clouds that completely describe the object itself;
  2. development of procedures for the registration of the point clouds;
  3. development of the procedures for the creation, starting from the registered views, of 3D models of the shapes;
  4. metrological validation of the models by means of the CMM.

Optical/Contact RE

The second purpose of the project (“Optical/Contact RE” in Fig. 3) is to optimize the RE process from the viewpoint of the accuracy of the representation of the object, without increasing the process time. The approach is close to that one represented in Fig. 2; however, the initial representation of the CAD model has to be obtained starting from the above mentioned 3D models.

Metrological validation of Point Clouds

The third purpose of the project (“Metrological validation of point clouds” in the Fig. 3) is closely related to the activity aimed at metrologically validating, by means of the CMM, the point clouds generated by the optical digitizer.

Validation for RP

The final goal of the project (“Validation for RP” in Fig. 3) is the verification of the suitability of the 3D models for the Rapid Prototyping process.

Results obtained

The activity carried out by our Laboratory resulted in two research products. The former is the optical digitizer OPL-3D. The design and the development of the instrument have been completely performed by the Laboratory. The metrological characterization has been performed in collaboration with the Laboratory located in Padova.
The latter is a suite of software tools for the alignement of the point clouds in the multi-view acquisition process. These tools perform, in a semi-automatic way, the estimate of the rototranslation matrixes between pairs of point clouds. A further improvement is performed by the research Laboratory located in Milan, basically aimed at achieving a completely automatic process. Below you can find more details about the procedures.

Relevant Publications

Carbone, V.; Carocci, M.; Savio, E.; Sansoni, G.; De Chiffre, L. “Combination of a Vision System and a Coordinate Measuring Machine for the Reverse Engineering of Freeform Surfaces“, The International Journal of Advanced Manufacturing Technology, Vol. 17, no. 4, pp. 263–271. 2001

Sansoni, G.; Patrioli, A. “Combination of optical and mechanical digitizers for use of reverse engineering of CAD models“, Proceedings of Optoelectronic Distance Measurements and Applications (ODIMAPIII), pp. 301-306. 2001

Sansoni, G.; Carocci, M. “Integration of a 3D vision sensor and a CMM for reverse engineering applications“, Italy-Canada Workshop on 3D Digital Imaging and Modeling Applications of Heritage, Industry, Medicine & Land. 2001

Sansoni, G.; Carmignato, S.; Savio, E. “Validation of the measurement performance of a three-dimensional vision sensor by means of a coordinate measuring machine“, Proceedings of the 21st IEEE Instrumentation and Measurement Technology Conference, Vol. 1, pp. 773-778. 2004

ferrari_punti.jpg

To learn more on 3D Vision applications in the automotive industry

The work performed on the Ferrari presents a number of similarities with respect to the work performed on the Winged Victory: it included the 3D optical digitization of the car, and the generation of a number of polygonal and CAD models.

Fig. 1 shows a view of the whole point cloud obtained by aligning and merging 280 partial point clouds. The step has been performed with the help of suitable markers placed on the surface, given the dramatic regularity of the shapes, and the need to keep the alignment error as lower as possible. Moreover, a skeleton of few, large views (550 x 480 mm), with height resolution of 0.2 mm and measurement variability of 0.1 mm has been obtained in the first step. Then, smaller views (370 x 300 mm), with resolution of 0.1 mm and measurement error of 0.06 mm, have been acquired and merged together using the skeleton as the reference.

Fig. 1 - Complete point cloud obtained after the alignment of the different views.
The multi-view alignment and the creation of the triangle model at high resolution have been performed by using the PolyWorks software. Then, the mesh has been saved in the STL format and imported into the Raindrop Geomagic Studio environment. Here, the triangles have been edited, topologically checked, and decimated at different levels of compression, mainly using only the automatic tools embedded in the software. Fig. 2 shows one of the most dense models obtained (1.5 million of triangles), while Fig. 3 depicts the model obtained after the compression of the previous one down to 10.000 triangles: despite the high compression here applied, the model presents a high level of adherence to the original measured data, thanks to the overall “smoothness” of the car surface.
Fig. 2 - Dense model obtained by the point cloud.

As the last step, the CAD model has been created starting from the triangle mesh of Fig. 2, with minimum intervention of the operator. Fig. 4 shows the rendering of this model (the IGES format is used, resulting in a 120 MB file). The prototype of the car has been obtained at the Laboratory of Fast Prototyping of the University of Udine. The process involved the stereo lithography technique. Similarly to the prototyping of the head of the Winged Victory it resulted into the 1:10 scaled reproduction shown in Fig. 5.

retro_ferrari.jpg
Fig. 4 - CAD model obtained rendered by the software.
prototipo_ferrari.jpg
Fig. 5 - The prototype obtained by fast prototyping. Dimension: 370 x 150 x 90 mm; Material: CIBATOOL SL 5190.

To learn more on the Winged Victory of Brescia

The following sub-sections give an idea of the steps performed to carry out the project, and briefly present the results.

STEP 1: THE ACQUISITION OF THE POINT CLOUDS

Fig. 1 shows the point clouds acquired in correspondence with the head of the statue. Following the requirement of the archaeologist staff, the digitizer has been configured to acquire at the highest resolution, even at the expense of a considerable number of views and of an increased complexity of the alignment process. In the figure, 41 views are shown after the alignment (performed in means of the PolyWorks IM_Align module). Each one is characterized by a lateral resolution of 0.2 mm, and a height resolution from 0.1 mm to 0.3 mm, depending on the quality of the measurement. The measurement error spans from 0.050 mm to 0.2 mm: this variability mainly depends on the colour of the surface and on the presence of numerous undercuts, holes, and shadow regions.

The body of the statue has been acquired at lower resolutions, depending on the different body segments. Special care has been taken to avoid misalignment between the views, especially considering that the registration process was very complex, due to the high number of point clouds (more than 500) needed to fully digitize the statue. The measurement was performed in two steps: in the former, the skeleton was acquired (few, large views at low resolution, along suitable paths around the statue), to minimize the alignment error. In the latter, a high number of small views was captured and aligned to the skeleton. At the end of the process, the skeleton was eliminated.
Fig. 1 - Point cloud obtained of the head of the statue, very dense of details.

STEP 2: THE CREATION OF THE TRIANGLE MODELS

The IM_Merge module of Polyworks has been used to generate the polygon model from the measured data. Preliminarily, proper filteringdecimation and fusion of the partial views were carried out. Models characterized by different levels of adherence to the original point cloud have been created. Fig. 2 shows that one at the highest accuracy that has been used by the archaeologists to perform the measurements between the pairs of fiduciary points.

The measurement is very easy: the operator only selects on the display the two triangles representative of the fiduciary points and the software automatically evaluates and displays the corresponding distance. The measurement is very precise, due to (i) the high quality of the original data, (ii) the availability of the colour information acquired with the range data, and (iii) the density of the triangles within each single marker, as highlighted in the zoom of the figure. 
vittoria_wire.jpg
Fig. 2 - High accuracy section of the head with a zoom of the eye. The measurment is very precise!

STEP 3: THE EDITING OF THE TRIANGLE MODELS

The Polyworks IM_Edit module was very useful for the editing of the triangle models. The objective was to eliminate holes, and in general all the topological irregularities deriving from the invalid measured data. As an example, Fig. 3 shows the appearance of the high-resolution triangle model of the head before the editing operation, while Fig. 4 shows the edited mesh obtained: it is easy to note how all the holes disappeared, resulting in a very appealing rendering of the surface. This model, when the colour information is added, as in Fig. 5, is suited also for applications different with respect to the original, metrological one. These are, for example, the virtual musealization of the statue, and the creation of a topologically closed STL model, that allows us the creation of the copy of the statue.
vittoria_modello_testa.jpg
Fig. 5 - The head of the Winged Victory with the colour information added on top of the mesh.

STEP 4: THE CREATION OF SCALED REPRODUCTIONS OF THE STATUE

This step has resulted in the achievement of a number of copies of the Winged Victory. In Fig. 6 the 1:8 scaled copy of the head of the statue is shown. The work has been accomplished in the framework of the collaboration between our Laboratory and the Laboratory of Fast Prototyping of the University of Udine. A rapid prototyping machine has been used to produce the model, by means of the stereo lithography technique. The CIBATOOL SL 5190 has been used as the material. The overall dimension of the prototype is 140 x 110 x 133 mm. The memory occupation of the original STL file was 10MB: it has been sent via internet to the Laboratory located in Udine. The time required to obtain the copy was 0.20 hours for the elaboration of the data, plus 15 hours for the prototypization.

Fig. 6 - The prototyped models of the Winged Victory head, before and after the colour application on top.

A suite of copies of the whole statue has been obtained in the framework of the collaboration between the Direzione Civici Musei di Arte e Storia of Brescia and the EOS Electro Optical Systems GmbH, located in Munich, Germany. The work led to the development of two 1:1 scaled copies of the statue have been produced. For them, the Laboratory has provided the high resolution STL file shown in Fig. 7 (16 millions of triangles).

The model was segmented into sub-parts, that were separately prototyped. Fig. 8 shows the copy of the statue that is currently placed in the hall of EOS gmbh, Robert-Stirling-Ring 1, 82152 Krailling Munchen DE.

Further experimentation dealing with the generation of the mathematics of the surfaces has been carried out. Obviously, we did not want to “redesign” the shape of the statue: instead, the objective was to verify the feasibility of the generation of the CAD model of the surfaces, in view of its use mainly in two applications. The former is the reconstruction of lost parts (for example, the fingers of the hands), the latter is the virtual modification of the relative position of sub-parts of the body. For example, this is the case of the position of the head of the statue, which seems excessively inclined with respect to the bust.

Step 5: the creation of the CAD models

The feasibility study has been performed on the head. The Raindrop Geomagic Studio 3.1 has been used. The triangle models of these two body segments have been imported as STL files from the PolyWorks suite. The Geomagic environment elaborated them and generated the CAD model in three steps. The first one allowed the determination of the patch layout (in a fully automatic way); the second one automatically identified a proper number of control points within each patch, the third one fitted the NURBS surfaces to the control points. The following figures show the process in the case of the head of the statue. It is worth noting the regularity of the surfaces at the borders of each patch (Fig. 9), the complexity of the CAD model (Fig. 10) and the adherence of the mathematics to the triangle model (Fig. 11).

Fig. 11 - The adherence of the rendered model on the point cloud measured one is really good, as highlighted in the figure.