This module has been developed to visualize the point clouds.
The main features of the tool are:
visualization by means of regular grids;
availability of basic functions as rotation, translation and scaling of the point clouds;
variable setting of the sampling step (i.e., of the resolution);
visualization of the colour information;
setting of the parameters of the visualization (grid colour, frame colour, point dimension, point colour, ecc.);
multi-document environment, for the visualization of different views of the same point cloud and/or different point clouds;
filtering of isolated points (outlayers);
editing of groups of points;
compatibility with the ROT (rotate), the OPL (Optolab), the OPT (Open Technologies s.r.l) and PIF (InnovMetric Inc.) file formats;
availability of an interactive, user friendly working environment, developed on the OpenGL library.
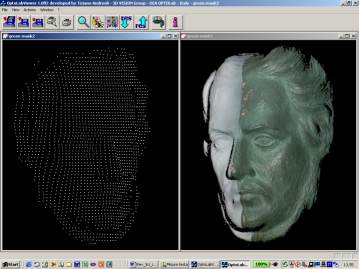
Fig. 1 shows an example of the facilities available in the module. The same point cloud is visualized in two independent windows, at different resolution, with the colour information (left view) and representing the only range information (right view). The visualization of multiple views is presented in Fig. 2.
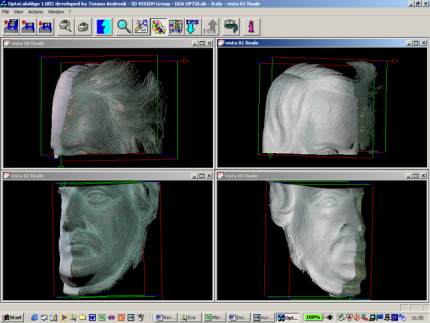
Fig. 1 - Visualization of the same point cloud in two independant windows.