Metrology techniques based on Industrial Vision are increasingly used both in research and industry. These are contactless techniques characterized by the use of optical devices, such as RGB and Depth cameras. In particular, multi-camera systems, i. e. systems composed of several cameras, are used to carry out three-dimensional measurements of various types. In addition to mechanical measurements this type of systems are often used to monitor the movements of human subjects within a given space, as well as for the reconstruction of three-dimensional objects and shapes.
To perform an accurate measurment, multi-camera systems must be carefully calibrated. The calibration process is a fundamental concept in Computer Vision applications that involve image-based measurements. In fact, Vision System calibration is a key factor to obtain reliable performances, as it allows to find the correspondence between the workspace and the points present on the images acquired by the cameras.
A multi-camera system calibration is the process that allows to obtain the geometric parameters related to distortions, positions and orientations of each camera that constitutes the system. It is therefore necessary to identify a mathematical model that takes into account both the internal functioning of the device and the relationship between the camera and the external world.
The calibration process consists of two parts:
The intrinsic calibration, necessary to model the individual devices in terms of focal length, coordinates of the main point and distortion coefficients of the acquired image;
The extrinsic calibration, necessary to determine the position and orientation of each device with respect to an absolute reference system. By means of extrinsic calibration it is possible to obtain the position of the camera reference system with respect to the absolute reference system in terms of rotation and translation.
Traditional calibration methods are based on the use of a calibration target, i. e. a known object, usually a plane object, on which there are calibration points that are unambiguously recognizable and have known coordinates. These calibration targets are automatically recognized by the system in order to calculate the position of the object with respect to the camera and thus obtain the parameters of rotation and translation of the camera with respect to the global reference system (Fig. 1).
Fig. 1 - Examples of traditional calibration masters.
The methods based on the recognition of three-dimensional shapes are based on the geometric coherence of a 3D object positioned in the field of view (FoV) of the various cameras. Each device records only a part of the target object and then, combining each view with the portion actually recorded by the camera, the relative displacement of the sensors with respect to the object is evaluated, thus obtaining the rotation and translation of the acquisition device itself (Fig. 2).
Fig. 2 - Example of a known object used as the calibration master, in this case a green sphere of a known diameter.
However, both traditional calibration methods and those based on the recognition of three-dimensional shapes have the disadvantage of being very complex and computationally expensive. In fact, former methods exploit the use of a generally flat calibration target which limits the positioning of the target itself because, under certain conditions and positions, it is not possible to obtain simultaneous views. The latter methods also require to converge to a solution, hence a good initialization of the parameters of 3D recognition by the operator is needed, resulting in low reliability and limited automation.
Finally, the methods based on the recognition of the human skeleton use as targets the skeleton joints of the human positioned within the FoV of the cameras. Skeleton based methods represent therefore an evolution of the 3D shape matching methods, since the human is considered as the target object (Fig. 3).
In this thesis work, we exploited skeleton based methods to create a new calibration method which is (i) easier to use compared to known methods, since users only need to stand in front of a camera and the system will take care of everything and (ii) faster and computationally inexpensive.
Fig. 3 - Example of a skeleton obtained by connecting the joints acquired from a Kinect camera (orange dots) and from a calibration set up based on multiple cameras (red dots).
STEP 1: Measurment set-up
The proposed set-up is very simple, as it is composed of a pair of Kinect v2 intrinsecally calibrated by using known procedures, a process required to correctly align the color information on top of the depth information acquired by the camera.
The cameras are placed in order to acquire the measurment area in a suitable way. After the calibration images have been taken, these are evaluated by a skeletonization algorithm based on OpenPose, which also takes into account the depth information to correctly place the skeleton in the 3D world [1]. Joints coordinates are therefore extracted for every pair of color-depth images correctly aligned both spatially and temporally.
To obtain accurate joint positions we also perform an optimization procedure afterwards to correctly place the joints on the human figure according to a minimization error procedure written in MATLAB.
Fig. 4 shows the abovementioned steps, while Fig. 5 shows a detail of the skeletonization algorithm used.
Fig. 4 - Steps required for the project. First we acquire both RGB and Depth frames from every Kinect, second we perform the skeletonization of the human using the skeletonization algorithm of choice and finally we use it to obtain the extrinsinc calibration matrix for each kinect, in order to reproject them to a known reference system.
Fig. 5 - Skeletonization procedure used by the algorithm.
STEP 2: Validation of the proposed procedure
To validate the system we used a mannequin placed still in 3 different positions (2 m, 3.5 m, 5 m) showing both the front and the back of it to the cameras. In fact, skeletonization procedures are usually more robust when humans are in a frontal position since also the face keypoints are visible. The validation positions are shown in Fig. 6, while the joint positions calculated by the procedure are shown in Fig. 7 and 8.
Fig. 6 - Validation positions of the mannequin. Only a single camera was used in this phase.
Fig. 7 - Joints calculated by the system when the mannequin is positioned in frontal position at (a) 2 m, (b) 3.5 m and (c) 5 m.
Fig. 8 - Joints calculated by the system when the mannequin is positioned in back position at (a) 2 m, (b) 3.5 m and (c) 5 m.
STEP 3: Calibration experiments
We tested the system in 3 configurations shown in Fig. 9: (a) when the two cameras are placed in front of the operator, one next to the other; (b) when a camera is positioned in front of the operator and the other is positioned laterally with an angle between them of 90°; (c) when the two cameras are positioned with an angle of 180° between them (one in front of the other, operator in the middle).
We first obtained the calibration matrix by using our procedure, hence the target used is the human subject placed in the middle of the scene (at position zero). Then, we compared the calibration matrix obtained in this way to the calibration matrix obtained from another algorithm developed by the University of Trento [2]. This algorithm is based on the recognition of a 3D known object, in this case the green sphere shown in Fig. 2.
The calibration obtained from both methods is evaluated using a 3D object, a cylinder of known shape which has been placed in 7 different positions in the scene as shown in Fig. 10. The exact same positions have been used for each configuration.
Fig. 9 - Configurations used for the calibration experiments.
Fig. 10 - Cylinder positions in the scene.
We finally compared the results aligning the point clouds obtained by using both calibration matrixes. These results have been elaborated in PolyWorks for better visualization, and are shown in the presentation below. Feel free to download it to know more about the project and to view the results!
Rapid prototyping, known as 3D printing or Additive Manufacturing, is a process that allows the creation of 3D objects by depositing material layer by layer. The materials used vary: plastic polymers, metals, ceramics or glass, depending on the principle used by the machine for prototyping, such as the deposit of the molten material or the welding of dust particles of the material itself by means of high-power lasers. This technique allows the creation of particular objects of extreme complexity including the so-called “trabecular structures“, structures that have very advantageous mechanical and physical properties (Fig. 1). They are in fact lightweight structures and at the same time very resistant and these characteristics have led them, in recent years, to be increasingly studied and used in application areas such as biomedical and automotive research fields.
Despite the high flexibility of prototyping machines, the complexity of these structures often generates differences between the designed structure and the final result of 3D printing. It is therefore necessary to design and build measuring benches that can detect such differences. The study of these differences is the subject of a Progetto di Ricerca di Interesse Nazionale (PRIN Prot. 2015BNWJZT), which provides a multi-competence and multidisciplinary approach, through the collaboration of various universities: the University of Brescia, the University of Perugia, the Polytechnic University of Marche and the University of Messina.
The aim of this thesis was to study the possible measurement set-ups involving both 2D and 3D vision. The solutions identified for the superficial dimensioning of the prototyped object (shown in Fig. 2) are:
a 3D measurement set-up with a light profile sensor;
a 2D measurement set-up with cameras, telecentric optics and collimated backlight.
In addition, a dimensional survey of the internal structure of the object was carried out thanks to to a tomographic scan of the structure made by a selected company.
Fig. 1 - Example of a Trabecular Structure.
Fig. 2 - The prototyped object studied in this thesis.
The 3D measurment set-up
The experimental set-up created involved a light profile sensor WENGLOR MLWL132. The object has been mounted on a micrometric slide to better perform the acquisitions (Fig. 3).
The point cloud is acquired by the sensor using a custom made LabView software. The whole object is scanned and the point cloud is then analyzed by using PolyWorks. Fig. 4 shows an example of acquisition, while Fig. 5 shows the errors between the point cloud obtained and the CAD model of the object.
Fig. 3 - 3D experimental set-up.
Fig. 4 - Example of acquisition using the light profile sensor.
Fig. 5 - Errors between the measured point cloud and the CAD model.
The 2D measurment set-up
The experimental set-up involving telecentric lenses is shown in Fig. 6. Telecentric lenses are fundamental to avoid camera distorsion especially when high resolution for low dimension measurments are required. The camera used is a iDS UI-1460SE, the telecentric lenses are an OPTO-ENGINEERING TC23036 and finally the retro-illuminator is an OPTO-ENGINEERING LTCLHP036-R (red light). In this set-up a spot was also dedicated to the calibration master required for the calibration of the camera.
The acquisitions obtained have some differences according to the use of the the retro-illuminator. Fig. 7, 8 and 9 show some examples of the acquisitions conducted.
Finally, the measured object was then compared to the tomography obtained from a selected company, resulting in the error map in Fig. 10.
Fig. 6 - 2D experimental set-up.
Fig. 10 - Error map obtained comparing the measured object to the tomography.
If you are interested in the project and want to read more about the procedure carried out in this thesis work, as well as the resulting measurments, download the presentation below.
Smart tracking systems are nowadays a necessity in different fields, especially the industrial one. A very interesting and successful open source software has been developed by the University of Padua, called OpenPTrack. The software, based on ROS (Robotic Operative System), is capable to keep track of humans in the scene, leveraging well known tracking algorithms that use point cloud 3D information, and also objects, leveraging the colour information as well.
Amazed by the capabilites of the software, we decided to study its performances further. This is the aim of this thesis project: to carefully characterize the measurment performances of OpenPTrack both of humans and objects, by using a set of Kinect v2 sensor.
Step 1: Calibration of the sensors
It is of utmost importance to correctly calibrate the sensors when performing a multi-sensor acquisition.
Two types of calibration are necessary: (i) the intrinsic calibration, to align the colour (or grayscale/IR like in the case of OpenPTrack) information acquired to the depth information (Fig. 1) and (ii) the extrinsic calibration, to align the different views obtained by the different cameras to a common reference system (Fig. 2).
The software provides the suitable tools to perform these steps, and also provides a tool to further refine the extrinsic calibration obtained (Fig. 3). In this case, a human operator has to walk around the scene: its trajectory is then acquired by every sensor and at the end of this registration the procedure aligns the trajectories in a more precise way.
Each of these calibration processes is completely automatic and performed by the software.
Fig. 1 - Examples of intrinsic calibration images. (a) RGB hd image, (b) IR image, (c) syncronized calibration of RGB and IR streams.
Fig. 2 - Scheme of an extrinsic calibration procedure. The second camera K2 must be referred to the first on K1, finally the two must be referred to an absolute reference system called Wd.
Fig. 3 - Examples of the calibration refinement. (a) Trajectories obtained by two Kinect not refined, (b) trajectories correctly aligned after the refinement procedure.
Step 2: Definition of measurment area
Two Kinect v2 were used for the project, mounted on tripods and placed in order to acquire the larger FoV possible (Fig. 4). A total of 31 positions were defined in the area: these are the spots where the targets to be measured have been placed in the two experiments, in order to cover all the FoV available. Note that not every spot lies in a region acquired by both Kinects, and that there are 3 performance regions highlighted in the figure: the overall most performing one (light green) and the single camera most performing ones, where only one camera (the one that is closer) sees the target with a good performance.
Fig. 4 - FoV acquired by the two Kinects. The numbers represent the different acquisition positions (31 in total) where the targets where placed in order to perform a stable acquisition and characterization of the measurment.
Step 3: Evaluation of Human Detection Algorithms
To evaluate the detection algorithms of OpenPTrack it has been used a mannequin placed firmly on the different spots as the measuring target. Its orientation is different for every acquisition (N, S, W, E) in order to better understand if the algorithm is able to correctly detect the barycenter of the mannequin even if it is rotated (Fig. 5).
The performances were evaluated using 4 parameters:
MOTA (Multiple Object Tracking Accuracy), to measure if the algorithm was able to detect the human in the scene;
MOTP (Multiple Object Tracking Precision), to measure the accuracy of the barycenter estimation relative to the human figure;
(Ex, Ey, Ez), the mean error between the estimation of the barycenter position and the reference barycenter position known, relative to every spatial dimension (x, y, z);
(Sx, Sy, Sz), the errors variability to measure the repetibility of the measurments for every spatial dimension (x, y, z).
Fig. 5 - Different orientations of the mannequin in the same spot.
Step 4: Evaluation of Object Detection algorithms
A different target has been used to evaluate the performances of Object Detection algorithms, shown in Fig. 6: it is a structure on which three spheres have been positioned on top of three rigid arms. The spheres are of different colours (R, G, B), to estimate how much the algorithm is colour-dependant, and different dimensions (200 mm, 160 mm, 100 mm), to estimante how much the algorithm is dimension-dependant. In this case, to estimate the performances of the algorithm the relative position between the spheres has been used as the reference measure (Fig. 7).
The performances were evaluated using the same parameters used for the Human Detection algorithm, but referred to the tracked object instead.
Fig. 6 - The different targets: in the first three images the spheres are of different colours but same dimension (200 mm, 160 mm and 100 mm), while in the last figure the sphere where all of the same colour (green) but of different dimensions.
Fig. 7 - Example of the reference positions of the spheres used.
If you want to know more about the project and the results obtained, please download the master thesis below.
This project focuses on the e-manufacturing of complex parts by integrating smart additive manufacturing technologies to more traditional manufacturing processes, in view of obtaining sustainable, flexible, completely automatic and fast manufacturing (SMART MANUFACTURING).
The project is funded by the POR FESR 2014-2020: Linea R&S per Aggregazioni 2015 Regione Lombardia, and involves SMEs and Research Laboratories in strong cooperation to demonstrate the feasibility of producing industrial manufacts in the automotive industry.
The role of the laboratory is the study and the implementation of vision tools for the on-line control of the manufacturing process based on the additive approach.
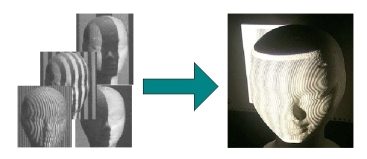
This project was developed in the context of the National Italian Project: Low-cost 3D imaging and modeling automatic system (LIMA3D). The Laboratory aim was to design, develop and perform a metrological characterization of a low-cost optical digitizer based on the projection of a single grating of non-coherent light.
SGPS (Single Grating Phase-Shift) is a whole field profilometer based on the projection of a single pattern of Ronchi fringes: a simple slide projector can be used instead of sophysticated, very expensive devices, to match the low-cost requirement.
A novel approach to the phase demodulation of the fringes has been developed to obtain phase values monotonically increasing along the direction perpendicular to the fringe orientation. As a result, the optical head can be calibrated in an absolute way, very dense point clouds expressed in an absolute reference system are obtained, the system set-up is very easy, the device is portable and reconfigurable to the measurement problem, and multi-view acquisition is easily performed.
The objective of this research project was the reduction of the mesurement time, and the possibility of using a simple slide projector instead of those based on LCD or DLP matrices.
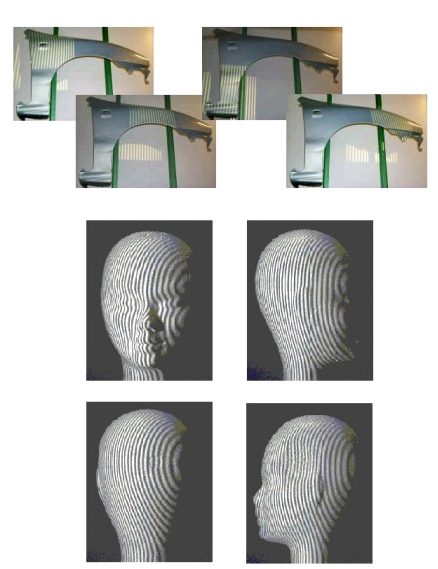
Fig. 1 shows the concept: the projecion of a number of fringe patterns, typical of the GCM, GCPS and PSM techniques is replaced by the projection of a single pattern, as for the SGM approach.
Fig. 1 - Example of a number of fringe pattern project onto surfaces and the novel single pattern projection proposed.
As depicted in Fig. 2, the optical head is simplified, and, in principle, it is possible to design the instrument in such a way that a very compact, low cost optical head is obtained.
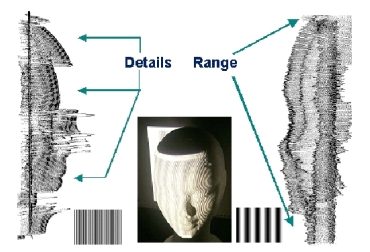
The slide projector typically projects steady patterns as the one shown in Fig. 3.
The elaboration follows the DFGM approach and results into two phase maps whose sensitivity to height variations is proportional to the period of the two components. The pattern at higher spatial period is used to save the range of the measurement, and the pattern at the lower period is used to increase the resolution (Fig. 4).
Fig. 4 - Scheme of the combination of the two patterns with high and low period.
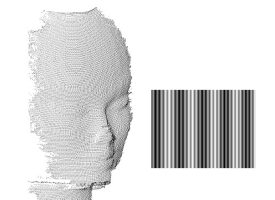
The information from the two phase maps is used by the tringulation formula to compute the height of the object (the relative approach is used). The triangulation is performed on a relative basis, i.e., the geometrical parameters of the optical head must be accurately determined and given as input to the system. The shape map is relative with respect to a reference surface (a plane).
Fig. 5 shows an example of the quality of the obtained point clouds. Typical values of the measurement errors are in the range of 0.2 mm – 0.3 mm over an illumination area of 300mm x 230mm, and a measurement interval up to 100mm.
Fig. 5 - Point Cloud example obtained by the system.
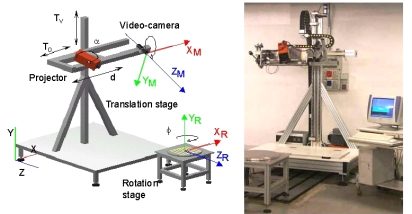
As shown in Fig. 1, the system is composed by the optical head and two moving stages. The optical head exploits active stereo vision. The projection device, LCD based, projects on the target object bi-dimensional patterns of non-coherent light suitable to implement the SGM, PSM GCM and GCPS techniques for light coding. Each point cloud is expressed in the reference system of the optical head (XM, YM, ZM).
The optical head is mounted on a moving stage, allowing its translation along the vertical and the horizontal directions (Tv, To); as shown in Fig. 2, areas large up to two square meters can be scanned and large surfaces can be measured by acquiring and aligning a number of separate patches. The objects presenting circular symmetry can be placed on a rotation stage: it enables the acquisition of views at different values of the rotation angle.
The system is equipped with stepped motors, to fully control the rotation and the translation of the optical head. Each view is aligned by means of rototraslation matrices in the coordinate system (XR, YR, ZR), centerd on the rotation stage. The sequence of acquisition of the range images is decided on the basis of the dimension and the shape of the object, and is performed automatically.
Fast calibration is provided, both for the optical head and for the rotation stage.
Fig. 1 - Schematization and image of the prototype.
Fig. 2 - Example of acquisitions of a large object (top) and a smaller one (bottom).
System Performances
Optical, non contact digitization based on active triangulation and non-coherent light projection;
Adjustable measuring area, from 100 x 100 mm to 400 x 400 mm (single view);
Measuring error from 0.07 mm to 0.2 mm, scaled with the Field of View;
Automatic scanning, alignment and merging, mechanically controlled;
Color/texture acquisition;
PC based system, with 333 Pentium II, Windows 98 and Visual C++ software
Import/Export formats for CAD, rapid prototyping, 3D-viewers, graphic platforms;
Software interface for the handling, the processing and the visualization of both partial and complete point clouds.
OPL-3D has been specifically designed for applications of reverse engineering and rapid prototyping, as well as for applications of measurement and quality control.
The system exploits active stereo vision (the absolute approach is implemented) using time-multiplexing based on the Gray-Code-Phase-Shifting method.
The projector-camera pair
OPL-3D can host a wide variety of projectors. In the left figure in Fig. 1 the device is the ABW LCD 320: it is a microprocessor-controlled and column-driven projector, specifically intended to be used in this class of systems. Alternatively, those devices currently available for video projection can be succesfully used, as that one shown on the right figure in Fig. 1 (Kodak DP 900, based on DLP technology).
The detector is a commercial CCD video camera. In the configurations shown in Fig. 1, the camera is an inexpensive colour Hitachi KP D50, with standard resolution (752 x 582 px). However, any type of camera (black/white or colour, with single or multiple CCDs for colour separation, and with different pixel densities) can be mounted on the system, depending on the application and on the projector used. In Fig. 2, for example, a 1300 x 1030 px digital video camera (Basler model) is mounted, to acquire at the required resolution large fields of views
The mount
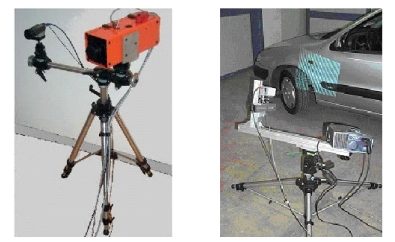
The projector and the camera are mounted onto a rigid bar, that can be easily moved around the scene by means of a tripod, and that holds the adjustment units for proper orientation. The mount is fully reconfigurable: all parameters can be varied according to the distance from the target, the required measurement resolution and the FoV (Fig. 3).
Given the fact that through sophisticated calibration procedures the system is able to finely estimate the operating parameters, no accurate positioning equipment (micropositioners, microrotators) is required, the only requirement being stability of the mount during the measurement procedure.
Fig. 4 shows two examples of on-site measurements of complex shapes where the full flexibility of the system was mandatory to perform the acquisition.
Fig. 3 - Images of the tripods used and of the equipment of the prototype.
Fig. 4 - Two on-site acquisition campaigns carried out by the Laboratory: the Winged Victory point cloud acquisition (left) and the Ferrari point cloud acquisition (right).
The electronic hardware
OPL-3D is equipped with a PC, that has the purpose of (i) driving the projector with the appropriate pattern sequence, (ii) acquiring the image sequences from the target, and (iii) elaborating the images. In addition, it contains all the features to perform sophisticated procedures for setting up and reconfiguration.
The PC is in the current configuration a Pentium III 900 MHz, 1 GB Ram, equipped with a Matrox Meteor II Frame Grabber. The Projector is operated by the PC through the Serial Connector.
PERFORMANCE
OPL-3D exhibits low-measurement uncertainty (120 mm) over large measurement areas (450 x 340 mm), linearly scalable in the case of smaller areas. Special care has been devoted to flexibility of use, in-field measurement setting, reconfigurability and robustness against environmental light changes and surface colour and texture.
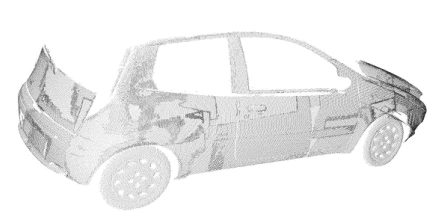
Fig. 5 shows the acquisition of the blue car already seen in Fig. 2. Multiview alignment and registration is performed by either purposely designed software or by means of commercially available products, depending on the complexity of the process.
Fig. 5 - Point Cloud obtained with every acquisition aligned to form a complete and dense reconstruction.
Technology transfer
OPL 3-D has been put into the market by Open Technologies s.r.l., Italy, a start-up company of the University of Brescia, under the Trade Name of 3DShape, in a manifold of versions, including sophisticated software for multi-view combination, point cloud manipulation and transformation, up to surface generation.
Two commercial software suites are successfully used by the Group to carry out the reverse engineering of very complex objects. These are the Polyworks 7.0 suite and the Raindrop Geomagic Studio 3.1 suite of programs.
Polyworks is specifically designed to obtain triangle meshes from point clouds. The IM-Align module is very powerful and allows us to perform the multiview acquisition when the number of point clouds is very high (from 30 to 500). The IM-Merge, IM-Edit and IM-Compress are used to create the triangle models, depending on the level of accuracy of the original point cloud, and on the accuracy required to the polygonal mesh. The work environment allows the operator to finely adjust, smooth, fill, join, close the final model by means of a considerable number of functions.
The Geomagic environment is designed to produce, from the original point cloud, the triangle models and the NURBS models. These are obtained starting from the triangle meshes. The software privileges the automation of the whole process with respect to the fine, local adjusting of the surfaces.
In the work carried out untill now, the Polyworks Suite has been preferred when (i) the measurement targets are characterised by a high level of complexity and by the presence of small details, (ii) the acquired point clouds result into a high number of invalid points and the quality of the measurement is not optimal, and (iii) the reverse engineering process requires only the generation of triangles. This is the case of the experimental work carried out in the summer of 2001 at the Civici Musei of Brescia, dealing with the modelling of the ‘Winged Victory’.
On the other hand, the Geomagic suite is used when (i) the shapes are generally regular and are efficiently elaborated (edited, filtered, topologically controlled) in an automatic way, (ii) the process time has to be kept low, (iii) the CAD model is required. The reverse engineering of the Ferrari 250MM has been performed in spring 2002 by using this software environment.
A Reverse Engineering example
The example reported here fully documents the reverse engineering process of the object in Fig. 1 carried out by using both the mentioned software products. It is a 1:4 scaled model of a F333 (by courtesy of Ferrari and Officine Michelotto). The following figures illustrate all the main steps of the test. These are:
the optical acquisition by means of OPL-3D (Fig. 1);
the alignment process to obtain the point cloud of the whole object (Fig. 2). It has been performed by using the IM-Align module;
the generation of the triangle model (Fig. 3). IM-Merge has been used in this step: it allowed the creation of a number of models at different levels of detail;
the generation of the CAD model (Fig. 4). It has been obtained by exporting the triangle model from the Polyworks environment to the Geomagic Environment (the STL format has been used), and by exploiting the powerful tools for the generation of the patch layout and the matematics of the surfaces available in Geomagic Studio 3.0.
Fig. 5 shows the rendered view of the CAD model.
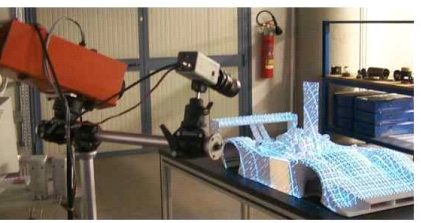
Fig.1 - The acquisition of the F333 by means of OPL-3D.
The purpose of this activity is the development of descriptive 3D models of the point clouds acquired by the optical digitisers developed at the Laboratory, for the implementation of the Reverse Engineering of complex shapes and in applications that priviledge the efficiency of the whole process with respect to its accuracy.
Typical fields are the production of prototypes and moulds within the collaborative design process and for copying applications, the restitution of cultural heritage, and the Virtual Reality.
The objective is also the implementation of an alternative path with respect to the traditional CAD-based process, to allow the user to model the physical shapes by means of meshes of simple geometrical elements, without requiring specialised knowledge and background, and at the same time providing total compatibility with the higher performance, higher cost, market available software environments, dedicated to CAD and copying applications.
The activity resulted in the development of a software tool called OptoSurfacer, with the following characteristics:
importing and ordering of dense and sparse point clouds, optically acquired;
detection and editing of undercuts and outlayers;
scaling, mirroring and translation of the entities;
automatic definition of the meshes that model the original measurement data;
flexible trimmering of the mesh topology depending on the object local curvature;
coding of the models in the IGES format to guarantee their usability in the CAD and CAM environments market available.
HOW TO OBTAIN THE MESHES?
The flow-chart in Fig. 1 describes the tasks performed by OptoSurfacer. They are illustrated for the study case of the object shown in Fig. 2 (a roof tile). The corresponding point cloud, shown in Fig. 3 has been acquired by means of the prototype DFGM (see the Prototypes page), and is characterised by a variability of the measurement of about 200 microns.
Fig. 3 - Corresponding point cloud of the roof tile obtained by means of the prototype DFGM.
OptoSurfacer automatically performs the ordering of the points by creating a regular reference grid and by using the surface shown in Fig. 4 as the basic geometrical element of the mesh. For the roof tile, the shapes have been modelled as shown in Fig. 5, and the resulting mesh is presented in Fig. 6. The irregularities well observable in this figure mainly depend on the roughness and the porosity of the material.
Fig. 4 - Basic geometrical element of the mesh.
Fig. 5 - Reference model to model the roof tile.
Fig. 6 - Resulting mesh of the roof tile obtained.
The solid model of the object has been obtained from the mesh representation of Fig. 6. OptoSurfacer generated the sections presented in Fig. 7 and, by blending them, the mathematics of the object. The final solid model is shown in Fig. 8: it is saved in the IGES format, and presents full compatibility with a wide number of CAD-CAM products market available.