OPL_Align is used to increase the quality of the alignment, especially in the case of very accurate point clouds that the performance of View-Integrator cannot align at the measurement accuracy. Also in this case, a pair-wise matching is used, based on the Iterative Closest Point approach. Fig. 1 shows an example of the performance of this tool.
The bass-rilief of Fig. 1 is chosen as the test object. The two partial views in the frames are shown in the OPL_Align environment in Fig. 2, where it is also evidenced the common region used to perform the alignment. The top figure in Fig. 3 shows the relative position between the two patches (Vista 1 and Vista 2 respectively) is shown before and after the alignment. The bottom figure in Fig. 3 shows the performance of the alignment.
Fig. 3 - Relative position between the two patches (top), performances of alignment (bottom).
View_Integrator exploits the correspondence between fiduciary points (markers) in different adjacent views. The procedure requires that the user interactively selects corresponding markers in the views to be aligned. Then it estimates with sub-pixel accuracy the 3D position of the centres of each marker and minimizes the sum of all the distances between the estimated centres until a preset threshold is reached. The surface shape suggests the typology of the markers used to determine the coordinates of the fiduciary points.
Placement of ‘hard’ markers
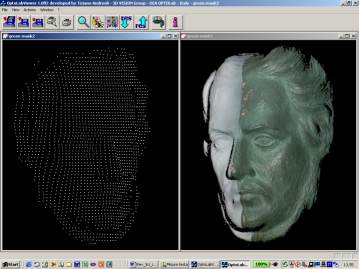
In some cases, markers of circular shape are physically placed on the surface. This approach has the advantage that we can freely move the object with respect to the optical head, acquire all the views needed to completely acquire it, with the only constraint that the overlapping regions contain the same set of markers. However, the markers are still present on the range information, inducing additional noise. Fig. 1 and Fig. 2 illustrate this experimental case. The object under test is a mannequin head. Fig. 1 shows the marker selection; Fig. 2 presents the corresponding 3D range images and their alignment.
Fig. 1 - Marker selection on the mannequin head.
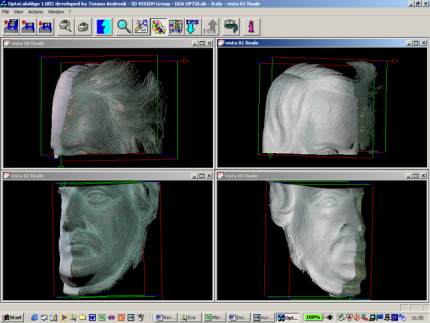
Fig. 2 - Alignment of the two views.
Placement of “soft markers”
As shown in Fig. 3, we can turn off the projection of the markers during the measurement, and turn it on for the acquisition of the color/texture information. In this way, the markers do not disturb the surface, and the alignment can be performed more accurately. Fig. 4 illustrates the View-Integrator interface during the selection of the markers, and the result of the alignment is presented in Fig. 5.
Fig. 5 - Result of the alignment of different views in a completed mesh.
Feature based selection of the markers
The last set of figures illustrate how the alignement of the views is performed in the case that neither “hard” nor “soft” markers are used. In this situation, the selection of the fiduciary points is based on the choice of corresponding features in the images; however, this task is very time consuming and critical for the operator, especially when the number of partial views to be aligned is high and when the color information superimposed to the range does not help the operator, as is the case of the two views shown in Fig. 6.
Our approach to solve this problem is the elaboration of the range information by means of the Canny edge detector. As shown in Fig. 7, the 3D images present significant edges that are well enhanced by the filter and dramatically simplify the operator work. Fig. 8 shows the effect of the Canny edge detector and Fig. 9 the matching between the views.
Fig. 6 - Dense views of a bas-relief.
Fig. 7 - The edges of the views are quite significant and can be used to enhance the alignment.
This module has been developed to visualize the point clouds.
The main features of the tool are:
visualization by means of regular grids;
availability of basic functions as rotation, translation and scaling of the point clouds;
variable setting of the sampling step (i.e., of the resolution);
visualization of the colour information;
setting of the parameters of the visualization (grid colour, frame colour, point dimension, point colour, ecc.);
multi-document environment, for the visualization of different views of the same point cloud and/or different point clouds;
filtering of isolated points (outlayers);
editing of groups of points;
compatibility with the ROT (rotate), the OPL (Optolab), the OPT (Open Technologies s.r.l) and PIF (InnovMetric Inc.) file formats;
availability of an interactive, user friendly working environment, developed on the OpenGL library.
Fig. 1 shows an example of the facilities available in the module. The same point cloud is visualized in two independent windows, at different resolution, with the colour information (left view) and representing the only range information (right view). The visualization of multiple views is presented in Fig. 2.
Fig. 1 - Visualization of the same point cloud in two independant windows.