The aim of this project is to create a remote control system for a robotic arm controlled by using the Kinect v2sensor, to track the movements of the user arm, without any additional point of measurement (marker-less modality).
The Kinect camera acquires a 3D point cloud of the body and a skeleton representation of the gesture/pose is obtained using the SDK library software provided by the Kinect. The skeleton joints are tracked and used to estimate the angles.
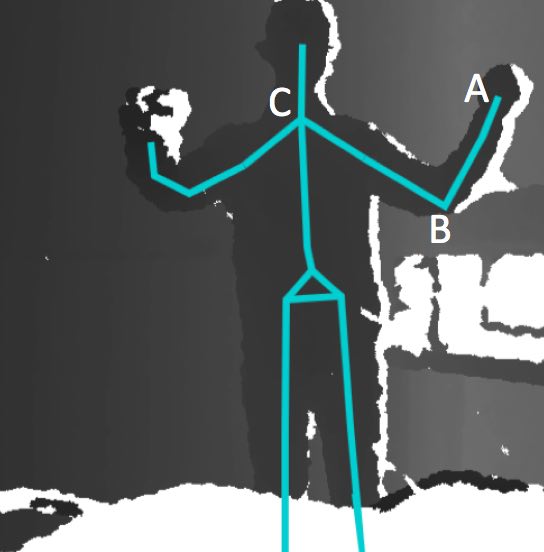
Figure 1 - The point cloud acquired by the Kinect, and the skeleton. Points A, B, and C are the joints.
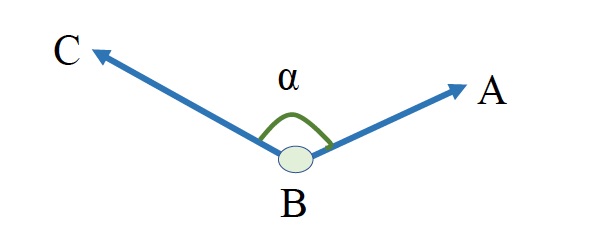
Point A is the joint of the wrist, point B is the joint of the elbow and point C is the joint of the shoulder. In the three dimensional space, vectors BA and BC are calculated with using the space coordinates of points A, B and C, which are taken from the skeleton. Angle α is calculated by using the dot product of the two vectors.
The software has been developed in C# inVisual Studio 2015.
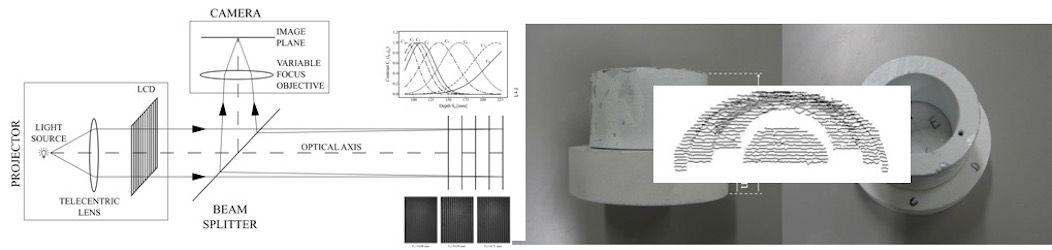
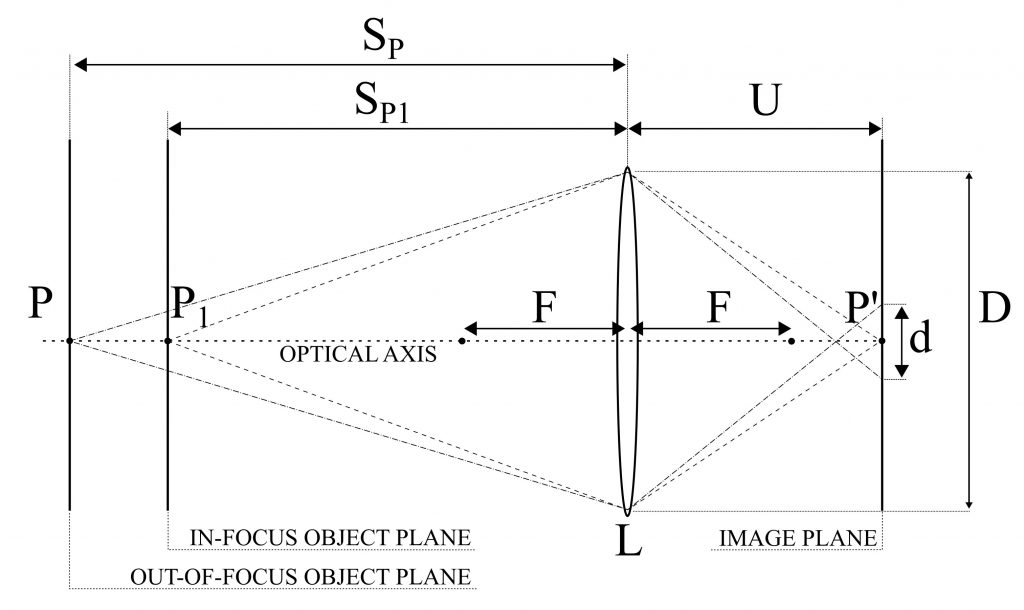
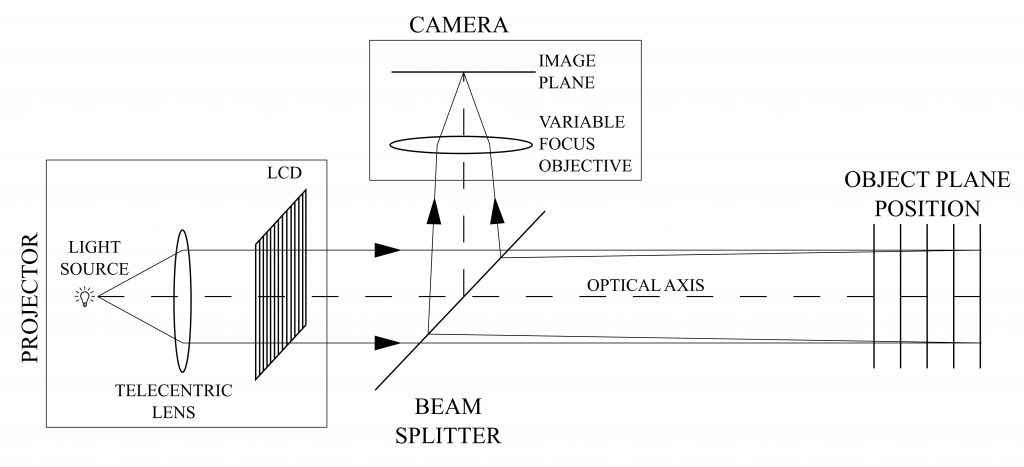
A novel Depth From Defocus (DFD) measurement system is has been developed. Here the extension of the measurement range is performed using an emergent technology based on liquid lenses. A suitable set of different focal lengths, obtained by properly changing the liquid lens supply voltage, provides multiple camera settings without duplicating the system elements or using moving parts.
A simple and compact setup, with a single camera/illuminator coaxial assembly is obtained. The measurement is based on an active DFD technique using modulation measurement profilometry(MMP) for the estimation of the contrast at each image point as a function of the depth range.
A suitable combination of multiple contrast curves, each one derived at a specific focal length, is proposed to extend the measurement range and to improve the measurement performances with respect to the state of the art.
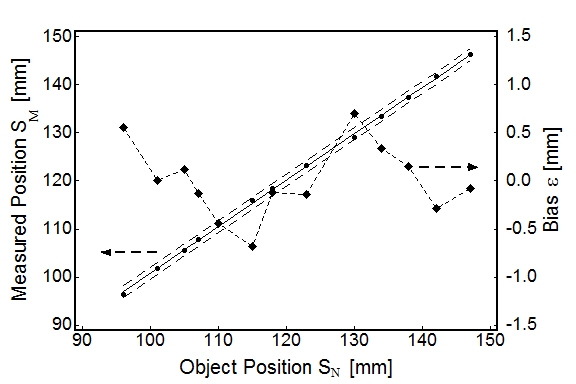
The system measurement errors are 0.53 mm over an extended measurement depth range of 135 mm, corresponding to 0.39 % of the depth range, resulting in an improved performance with respect to the state of the art DFD systems, for which typical values are in the 0.7-1.6 % of the depth range.
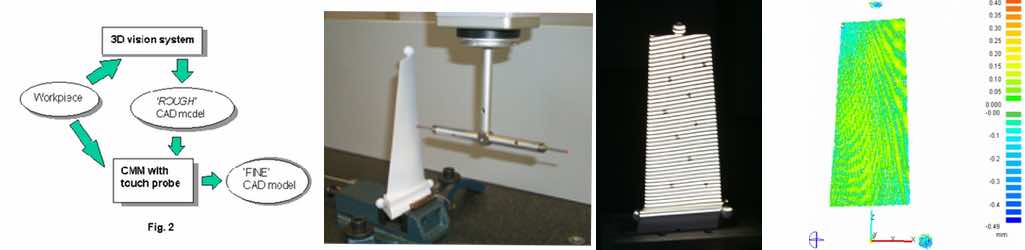
This activity was carried out in the frame of a collaboration between our Laboratory and the DIMEG Metrological Laboratory of the University of Padova. It was aimed at integrating the measurement information from a 3D Vision sensor and a Coordinate Measuring Machine (CMM) for the reverse engineering of free-form surfaces. The objective was to reconstruct the CAD model of comples shapes with high accuracy and at the same time rapidly, and minimising the operator time.
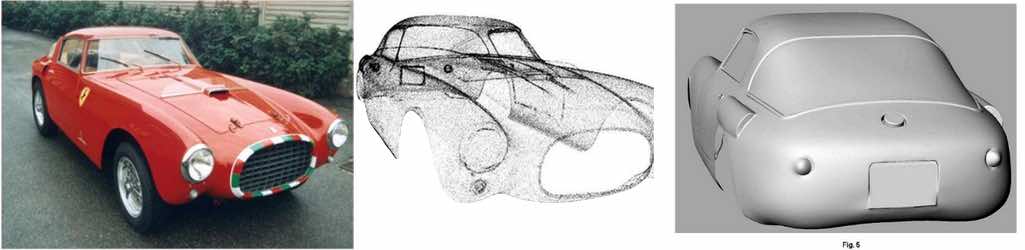
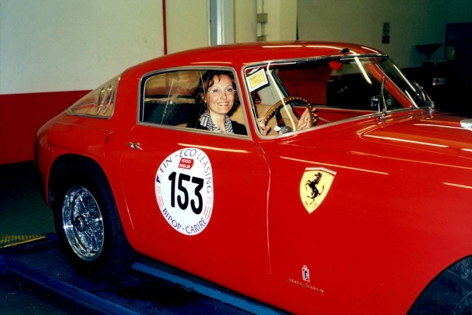
This project was performed to demonstrate the feasibility of using an optical 3d range sensor based on fringe projection (OPL-3D) to acquire the shell of the Ferrari Mille Miglia shown in the figure. The point cloud were merged and the whole mash was obtained. A scaled copy of the shell was prototyped.
The project is aimed at studying a very specific typology of archaeological finds, called the ‘Tavolette enigmatiche‘ or ‘Brotlaibidole‘. The activity developed at the Laboratory focused on (i) the optical 3D acquisition of the pieces, (ii) the creation of 3D meshes, and (iii) the study of the occurrences and of the morphological signs impressed on them.
This work is part of a larger activity that involves a number of partners. These are the Regione Lombardia (A.M. Ravagnan), the Provincia di Mantova (T. Grizzi), the Comune di Cavriana (B. Righetti), the Museo Archeologico dell’Alto Mantovano (A. Piccoli), the Università di Verona (S. Marchesini).
The “Brotlaibidole” are small baked-clay objects of prevalently ovoid shape of the 2100-1400 B.C. periods, engraved with symbols and drilled holes whose meaning is still unknown.
Their presence in Italy and in many countries in the northeast Europe represents an “enigma” for the specialists. The reason is that the shape and the orientation of the signs is very similar among the objects, even if they have been found in different geographical sites.
Hence, we have been required to accomplish an extensive measurement campaign in Europe, and to produce and collect the 3D models in a unique database, in view of their future study by the specialists. To carry out the measurement, we used the Vivid 910 sensor (Konica Minolta Inc.). Besides the measurement performances, that well suit to the resolutions required in this application, the system is rugged, portable, and fast in the setup and the acquisition processes. So far, 30 specimens have been acquired, modeled and organized in a database. Their resolution is 120μm.
Following the acquisition and point-cloud elaboration, we carried out a selection of symbols to be compared. The different symbols were extracted from the models and properly oriented in a suitable reference frame.
Symbols from different “pieces” were then superimposed and aligned, in a totally automatic way.
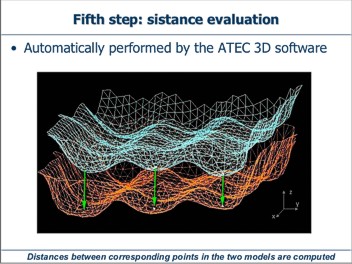
Color coding was used as a user-friendly way to obtain information about the amount of overlapping between the two symbols. All these steps were performed by the self developed “ATEC-3D” software: a user-friendly environment, specifically intended to be used by a non software expert such as an archaeologist.
In the ATEC-3D panel, the signs to be compared are chosen, and they appear as 3D models. Point clouds and their superposition in color coding are presented after suitable automatic registration and distance compensation. An index of similarity (rms value of the differences) is obtained to quantitatively assess the goodness of overlapping.
This process has been tested on a suitable number of self-made signs used as references, printed onto clay surfaces under different angles and with different pressures.
The ATEC-3D software has been delivered to the archaeologists, who have now started the overall comparison of all signs derived from the 30 models, whose 3D acquisition has been made and whose signs are now in the common database.
The purpose of this activity is the development of descriptive 3D models of the point clouds acquired by the optical digitisers developed at the Laboratory, for the implementation of the Reverse Engineering of complex shapes and in applications that priviledge the efficiency of the whole process with respect to its accuracy.
Typical fields are the production of prototypes and moulds within the collaborative design process and for copying applications, the restitution of cultural heritage, and the Virtual Reality.
The objective is also the implementation of an alternative path with respect to the traditional CAD-based process, to allow the user to model the physical shapes by means of meshes of simple geometrical elements, without requiring specialised knowledge and background, and at the same time providing total compatibility with the higher performance, higher cost, market available software environments, dedicated to CAD and copying applications.
The activity resulted in the development of a software tool called OptoSurfacer, with the following characteristics:
importing and ordering of dense and sparse point clouds, optically acquired;
detection and editing of undercuts and outlayers;
scaling, mirroring and translation of the entities;
automatic definition of the meshes that model the original measurement data;
flexible trimmering of the mesh topology depending on the object local curvature;
coding of the models in the IGES format to guarantee their usability in the CAD and CAM environments market available.
HOW TO OBTAIN THE MESHES?
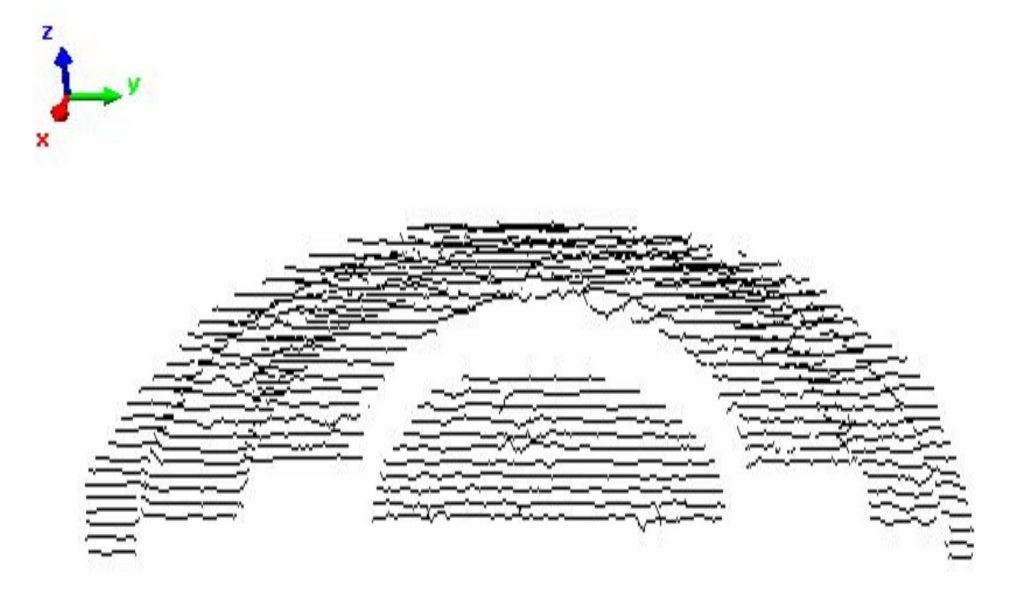
The flow-chart in Fig. 1 describes the tasks performed by OptoSurfacer. They are illustrated for the study case of the object shown in Fig. 2 (a roof tile). The corresponding point cloud, shown in Fig. 3 has been acquired by means of the prototype DFGM (see the Prototypes page), and is characterised by a variability of the measurement of about 200 microns.
Fig. 3 - Corresponding point cloud of the roof tile obtained by means of the prototype DFGM.
OptoSurfacer automatically performs the ordering of the points by creating a regular reference grid and by using the surface shown in Fig. 4 as the basic geometrical element of the mesh. For the roof tile, the shapes have been modelled as shown in Fig. 5, and the resulting mesh is presented in Fig. 6. The irregularities well observable in this figure mainly depend on the roughness and the porosity of the material.
Fig. 4 - Basic geometrical element of the mesh.
Fig. 5 - Reference model to model the roof tile.
Fig. 6 - Resulting mesh of the roof tile obtained.
The solid model of the object has been obtained from the mesh representation of Fig. 6. OptoSurfacer generated the sections presented in Fig. 7 and, by blending them, the mathematics of the object. The final solid model is shown in Fig. 8: it is saved in the IGES format, and presents full compatibility with a wide number of CAD-CAM products market available.
View_Integrator exploits the correspondence between fiduciary points (markers) in different adjacent views. The procedure requires that the user interactively selects corresponding markers in the views to be aligned. Then it estimates with sub-pixel accuracy the 3D position of the centres of each marker and minimizes the sum of all the distances between the estimated centres until a preset threshold is reached. The surface shape suggests the typology of the markers used to determine the coordinates of the fiduciary points.
Placement of ‘hard’ markers
In some cases, markers of circular shape are physically placed on the surface. This approach has the advantage that we can freely move the object with respect to the optical head, acquire all the views needed to completely acquire it, with the only constraint that the overlapping regions contain the same set of markers. However, the markers are still present on the range information, inducing additional noise. Fig. 1 and Fig. 2 illustrate this experimental case. The object under test is a mannequin head. Fig. 1 shows the marker selection; Fig. 2 presents the corresponding 3D range images and their alignment.
Fig. 1 - Marker selection on the mannequin head.
Fig. 2 - Alignment of the two views.
Placement of “soft markers”
As shown in Fig. 3, we can turn off the projection of the markers during the measurement, and turn it on for the acquisition of the color/texture information. In this way, the markers do not disturb the surface, and the alignment can be performed more accurately. Fig. 4 illustrates the View-Integrator interface during the selection of the markers, and the result of the alignment is presented in Fig. 5.
Fig. 5 - Result of the alignment of different views in a completed mesh.
Feature based selection of the markers
The last set of figures illustrate how the alignement of the views is performed in the case that neither “hard” nor “soft” markers are used. In this situation, the selection of the fiduciary points is based on the choice of corresponding features in the images; however, this task is very time consuming and critical for the operator, especially when the number of partial views to be aligned is high and when the color information superimposed to the range does not help the operator, as is the case of the two views shown in Fig. 6.
Our approach to solve this problem is the elaboration of the range information by means of the Canny edge detector. As shown in Fig. 7, the 3D images present significant edges that are well enhanced by the filter and dramatically simplify the operator work. Fig. 8 shows the effect of the Canny edge detector and Fig. 9 the matching between the views.
Fig. 6 - Dense views of a bas-relief.
Fig. 7 - The edges of the views are quite significant and can be used to enhance the alignment.
The following sub-sections give an idea of the steps performed to carry out the project, and briefly present the results.
STEP 1: THE ACQUISITION OF THE POINT CLOUDS
Fig. 1 shows the point clouds acquired in correspondence with the head of the statue. Following the requirement of the archaeologist staff, the digitizer has been configured to acquire at the highest resolution, even at the expense of a considerable number of views and of an increased complexity of the alignment process. In the figure, 41 views are shown after the alignment (performed in means of the PolyWorks IM_Align module). Each one is characterized by a lateral resolution of 0.2 mm, and a height resolution from 0.1 mm to 0.3 mm, depending on the quality of the measurement. The measurement error spans from 0.050 mm to 0.2 mm: this variability mainly depends on the colour of the surface and on the presence of numerous undercuts, holes, and shadow regions.
The body of the statue has been acquired at lower resolutions, depending on the different body segments. Special care has been taken to avoid misalignment between the views, especially considering that the registration process was very complex, due to the high number of point clouds (more than 500) needed to fully digitize the statue. The measurement was performed in two steps: in the former, the skeleton was acquired (few, large views at low resolution, along suitable paths around the statue), to minimize the alignment error. In the latter, a high number of small views was captured and aligned to the skeleton. At the end of the process, the skeleton was eliminated.
Fig. 1 - Point cloud obtained of the head of the statue, very dense of details.
STEP 2: THE CREATION OF THE TRIANGLE MODELS
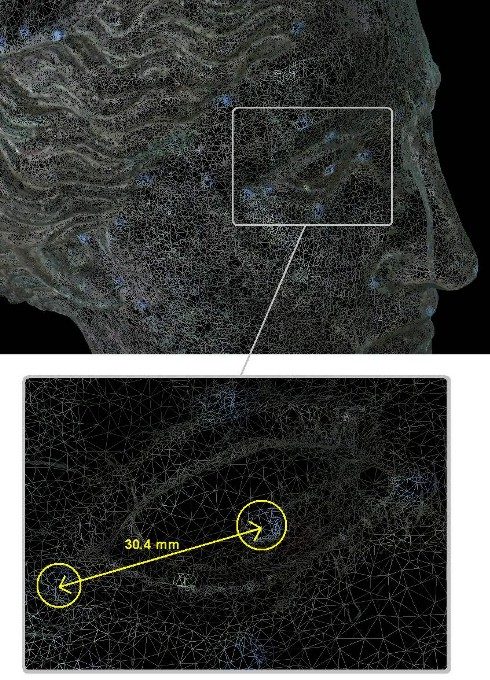
The IM_Merge module of Polyworks has been used to generate the polygon model from the measured data. Preliminarily, proper filtering, decimation and fusion of the partial views were carried out. Models characterized by different levels of adherence to the original point cloud have been created. Fig. 2 shows that one at the highest accuracy that has been used by the archaeologists to perform the measurements between the pairs of fiduciary points.
The measurement is very easy: the operator only selects on the display the two triangles representative of the fiduciary points and the software automatically evaluates and displays the corresponding distance. The measurement is very precise, due to (i) the high quality of the original data, (ii) the availability of the colour information acquired with the range data, and (iii) the density of the triangles within each single marker, as highlighted in the zoom of the figure.
Fig. 2 - High accuracy section of the head with a zoom of the eye. The measurment is very precise!
STEP 3: THE EDITING OF THE TRIANGLE MODELS
The Polyworks IM_Edit module was very useful for the editing of the triangle models. The objective was to eliminate holes, and in general all the topological irregularities deriving from the invalid measured data. As an example, Fig. 3 shows the appearance of the high-resolution triangle model of the head before the editing operation, while Fig. 4 shows the edited mesh obtained: it is easy to note how all the holes disappeared, resulting in a very appealing rendering of the surface. This model, when the colour information is added, as in Fig. 5, is suited also for applications different with respect to the original, metrological one. These are, for example, the virtual musealization of the statue, and the creation of a topologically closed STL model, that allows us the creation of the copy of the statue.
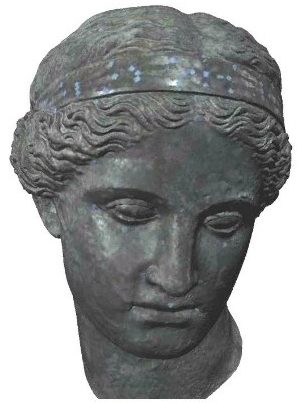
Fig. 5 - The head of the Winged Victory with the colour information added on top of the mesh.
STEP 4: THE CREATION OF SCALED REPRODUCTIONS OF THE STATUE
This step has resulted in the achievement of a number of copies of the Winged Victory. In Fig. 6 the 1:8 scaled copy of the head of the statue is shown. The work has been accomplished in the framework of the collaboration between our Laboratory and the Laboratory of Fast Prototyping of the University of Udine. A rapid prototyping machine has been used to produce the model, by means of the stereo lithography technique. The CIBATOOL SL 5190 has been used as the material. The overall dimension of the prototype is 140 x 110 x 133 mm. The memory occupation of the original STL file was 10MB: it has been sent via internet to the Laboratory located in Udine. The time required to obtain the copy was 0.20 hours for the elaboration of the data, plus 15 hours for the prototypization.
Fig. 6 - The prototyped models of the Winged Victory head, before and after the colour application on top.
A suite of copies of the whole statue has been obtained in the framework of the collaboration between the Direzione Civici Musei di Arte e Storia of Brescia and the EOS Electro Optical Systems GmbH, located in Munich, Germany. The work led to the development of two 1:1 scaled copies of the statue have been produced. For them, the Laboratory has provided the high resolution STL file shown in Fig. 7 (16 millions of triangles).
The model was segmented into sub-parts, that were separately prototyped. Fig. 8 shows the copy of the statue that is currently placed in the hall of EOS gmbh, Robert-Stirling-Ring 1, 82152 Krailling Munchen DE.
Further experimentation dealing with the generation of the mathematics of the surfaces has been carried out. Obviously, we did not want to “redesign” the shape of the statue: instead, the objective was to verify the feasibility of the generation of the CAD model of the surfaces, in view of its use mainly in two applications. The former is the reconstruction of lost parts (for example, the fingers of the hands), the latter is the virtual modification of the relative position of sub-parts of the body. For example, this is the case of the position of the head of the statue, which seems excessively inclined with respect to the bust.
Step 5: the creation of the CAD models
The feasibility study has been performed on the head. The Raindrop Geomagic Studio 3.1 has been used. The triangle models of these two body segments have been imported as STL files from the PolyWorks suite. The Geomagic environment elaborated them and generated the CAD model in three steps. The first one allowed the determination of the patch layout (in a fully automatic way); the second one automatically identified a proper number of control points within each patch, the third one fitted the NURBS surfaces to the control points. The following figures show the process in the case of the head of the statue. It is worth noting the regularity of the surfaces at the borders of each patch (Fig. 9), the complexity of the CAD model (Fig. 10) and the adherence of the mathematics to the triangle model (Fig. 11).
Fig. 11 - The adherence of the rendered model on the point cloud measured one is really good, as highlighted in the figure.