Smart tracking systems are nowadays a necessity in different fields, especially the industrial one. A very interesting and successful open source software has been developed by the University of Padua, called OpenPTrack. The software, based on ROS (Robotic Operative System), is capable to keep track of humans in the scene, leveraging well known tracking algorithms that use point cloud 3D information, and also objects, leveraging the colour information as well.
Amazed by the capabilites of the software, we decided to study its performances further. This is the aim of this thesis project: to carefully characterize the measurment performances of OpenPTrack both of humans and objects, by using a set of Kinect v2 sensor.
Step 1: Calibration of the sensors
It is of utmost importance to correctly calibrate the sensors when performing a multi-sensor acquisition.
Two types of calibration are necessary: (i) the intrinsic calibration, to align the colour (or grayscale/IR like in the case of OpenPTrack) information acquired to the depth information (Fig. 1) and (ii) the extrinsic calibration, to align the different views obtained by the different cameras to a common reference system (Fig. 2).
The software provides the suitable tools to perform these steps, and also provides a tool to further refine the extrinsic calibration obtained (Fig. 3). In this case, a human operator has to walk around the scene: its trajectory is then acquired by every sensor and at the end of this registration the procedure aligns the trajectories in a more precise way.
Each of these calibration processes is completely automatic and performed by the software.
Fig. 1 - Examples of intrinsic calibration images. (a) RGB hd image, (b) IR image, (c) syncronized calibration of RGB and IR streams.
Fig. 2 - Scheme of an extrinsic calibration procedure. The second camera K2 must be referred to the first on K1, finally the two must be referred to an absolute reference system called Wd.
Fig. 3 - Examples of the calibration refinement. (a) Trajectories obtained by two Kinect not refined, (b) trajectories correctly aligned after the refinement procedure.
Step 2: Definition of measurment area
Two Kinect v2 were used for the project, mounted on tripods and placed in order to acquire the larger FoV possible (Fig. 4). A total of 31 positions were defined in the area: these are the spots where the targets to be measured have been placed in the two experiments, in order to cover all the FoV available. Note that not every spot lies in a region acquired by both Kinects, and that there are 3 performance regions highlighted in the figure: the overall most performing one (light green) and the single camera most performing ones, where only one camera (the one that is closer) sees the target with a good performance.
Fig. 4 - FoV acquired by the two Kinects. The numbers represent the different acquisition positions (31 in total) where the targets where placed in order to perform a stable acquisition and characterization of the measurment.
Step 3: Evaluation of Human Detection Algorithms
To evaluate the detection algorithms of OpenPTrack it has been used a mannequin placed firmly on the different spots as the measuring target. Its orientation is different for every acquisition (N, S, W, E) in order to better understand if the algorithm is able to correctly detect the barycenter of the mannequin even if it is rotated (Fig. 5).
The performances were evaluated using 4 parameters:
MOTA (Multiple Object Tracking Accuracy), to measure if the algorithm was able to detect the human in the scene;
MOTP (Multiple Object Tracking Precision), to measure the accuracy of the barycenter estimation relative to the human figure;
(Ex, Ey, Ez), the mean error between the estimation of the barycenter position and the reference barycenter position known, relative to every spatial dimension (x, y, z);
(Sx, Sy, Sz), the errors variability to measure the repetibility of the measurments for every spatial dimension (x, y, z).
Fig. 5 - Different orientations of the mannequin in the same spot.
Step 4: Evaluation of Object Detection algorithms
A different target has been used to evaluate the performances of Object Detection algorithms, shown in Fig. 6: it is a structure on which three spheres have been positioned on top of three rigid arms. The spheres are of different colours (R, G, B), to estimate how much the algorithm is colour-dependant, and different dimensions (200 mm, 160 mm, 100 mm), to estimante how much the algorithm is dimension-dependant. In this case, to estimate the performances of the algorithm the relative position between the spheres has been used as the reference measure (Fig. 7).
The performances were evaluated using the same parameters used for the Human Detection algorithm, but referred to the tracked object instead.
Fig. 6 - The different targets: in the first three images the spheres are of different colours but same dimension (200 mm, 160 mm and 100 mm), while in the last figure the sphere where all of the same colour (green) but of different dimensions.
Fig. 7 - Example of the reference positions of the spheres used.
If you want to know more about the project and the results obtained, please download the master thesis below.
The objective of this research project was the reduction of the mesurement time, and the possibility of using a simple slide projector instead of those based on LCD or DLP matrices.
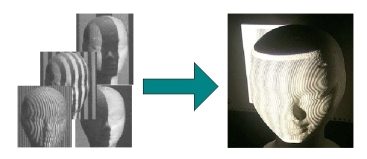
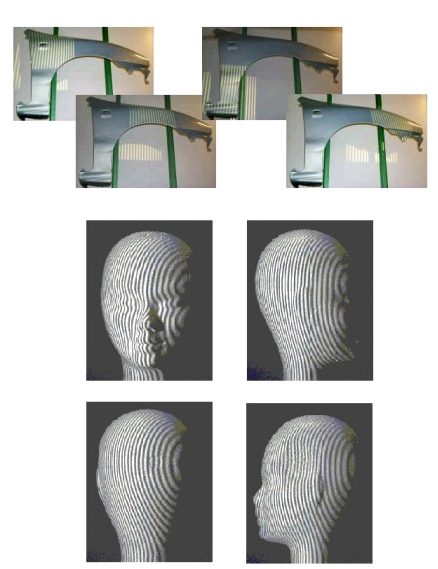
Fig. 1 shows the concept: the projecion of a number of fringe patterns, typical of the GCM, GCPS and PSM techniques is replaced by the projection of a single pattern, as for the SGM approach.
Fig. 1 - Example of a number of fringe pattern project onto surfaces and the novel single pattern projection proposed.
As depicted in Fig. 2, the optical head is simplified, and, in principle, it is possible to design the instrument in such a way that a very compact, low cost optical head is obtained.
The slide projector typically projects steady patterns as the one shown in Fig. 3.
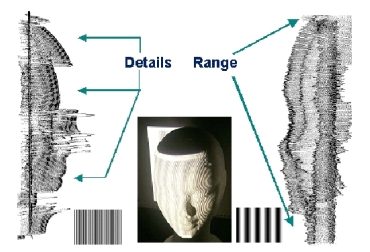
The elaboration follows the DFGM approach and results into two phase maps whose sensitivity to height variations is proportional to the period of the two components. The pattern at higher spatial period is used to save the range of the measurement, and the pattern at the lower period is used to increase the resolution (Fig. 4).
Fig. 4 - Scheme of the combination of the two patterns with high and low period.
The information from the two phase maps is used by the tringulation formula to compute the height of the object (the relative approach is used). The triangulation is performed on a relative basis, i.e., the geometrical parameters of the optical head must be accurately determined and given as input to the system. The shape map is relative with respect to a reference surface (a plane).
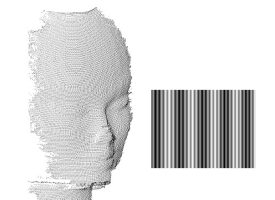
Fig. 5 shows an example of the quality of the obtained point clouds. Typical values of the measurement errors are in the range of 0.2 mm – 0.3 mm over an illumination area of 300mm x 230mm, and a measurement interval up to 100mm.
Fig. 5 - Point Cloud example obtained by the system.
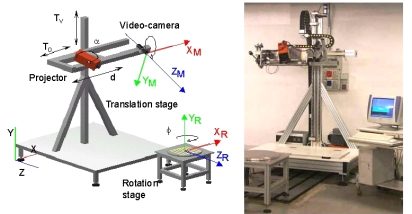
As shown in Fig. 1, the system is composed by the optical head and two moving stages. The optical head exploits active stereo vision. The projection device, LCD based, projects on the target object bi-dimensional patterns of non-coherent light suitable to implement the SGM, PSM GCM and GCPS techniques for light coding. Each point cloud is expressed in the reference system of the optical head (XM, YM, ZM).
The optical head is mounted on a moving stage, allowing its translation along the vertical and the horizontal directions (Tv, To); as shown in Fig. 2, areas large up to two square meters can be scanned and large surfaces can be measured by acquiring and aligning a number of separate patches. The objects presenting circular symmetry can be placed on a rotation stage: it enables the acquisition of views at different values of the rotation angle.
The system is equipped with stepped motors, to fully control the rotation and the translation of the optical head. Each view is aligned by means of rototraslation matrices in the coordinate system (XR, YR, ZR), centerd on the rotation stage. The sequence of acquisition of the range images is decided on the basis of the dimension and the shape of the object, and is performed automatically.
Fast calibration is provided, both for the optical head and for the rotation stage.
Fig. 1 - Schematization and image of the prototype.
Fig. 2 - Example of acquisitions of a large object (top) and a smaller one (bottom).
System Performances
Optical, non contact digitization based on active triangulation and non-coherent light projection;
Adjustable measuring area, from 100 x 100 mm to 400 x 400 mm (single view);
Measuring error from 0.07 mm to 0.2 mm, scaled with the Field of View;
Automatic scanning, alignment and merging, mechanically controlled;
Color/texture acquisition;
PC based system, with 333 Pentium II, Windows 98 and Visual C++ software
Import/Export formats for CAD, rapid prototyping, 3D-viewers, graphic platforms;
Software interface for the handling, the processing and the visualization of both partial and complete point clouds.
The purpose of this activity is the development of descriptive 3D models of the point clouds acquired by the optical digitisers developed at the Laboratory, for the implementation of the Reverse Engineering of complex shapes and in applications that priviledge the efficiency of the whole process with respect to its accuracy.
Typical fields are the production of prototypes and moulds within the collaborative design process and for copying applications, the restitution of cultural heritage, and the Virtual Reality.
The objective is also the implementation of an alternative path with respect to the traditional CAD-based process, to allow the user to model the physical shapes by means of meshes of simple geometrical elements, without requiring specialised knowledge and background, and at the same time providing total compatibility with the higher performance, higher cost, market available software environments, dedicated to CAD and copying applications.
The activity resulted in the development of a software tool called OptoSurfacer, with the following characteristics:
importing and ordering of dense and sparse point clouds, optically acquired;
detection and editing of undercuts and outlayers;
scaling, mirroring and translation of the entities;
automatic definition of the meshes that model the original measurement data;
flexible trimmering of the mesh topology depending on the object local curvature;
coding of the models in the IGES format to guarantee their usability in the CAD and CAM environments market available.
HOW TO OBTAIN THE MESHES?
The flow-chart in Fig. 1 describes the tasks performed by OptoSurfacer. They are illustrated for the study case of the object shown in Fig. 2 (a roof tile). The corresponding point cloud, shown in Fig. 3 has been acquired by means of the prototype DFGM (see the Prototypes page), and is characterised by a variability of the measurement of about 200 microns.
Fig. 3 - Corresponding point cloud of the roof tile obtained by means of the prototype DFGM.
OptoSurfacer automatically performs the ordering of the points by creating a regular reference grid and by using the surface shown in Fig. 4 as the basic geometrical element of the mesh. For the roof tile, the shapes have been modelled as shown in Fig. 5, and the resulting mesh is presented in Fig. 6. The irregularities well observable in this figure mainly depend on the roughness and the porosity of the material.
Fig. 4 - Basic geometrical element of the mesh.
Fig. 5 - Reference model to model the roof tile.
Fig. 6 - Resulting mesh of the roof tile obtained.
The solid model of the object has been obtained from the mesh representation of Fig. 6. OptoSurfacer generated the sections presented in Fig. 7 and, by blending them, the mathematics of the object. The final solid model is shown in Fig. 8: it is saved in the IGES format, and presents full compatibility with a wide number of CAD-CAM products market available.
OPL_Align is used to increase the quality of the alignment, especially in the case of very accurate point clouds that the performance of View-Integrator cannot align at the measurement accuracy. Also in this case, a pair-wise matching is used, based on the Iterative Closest Point approach. Fig. 1 shows an example of the performance of this tool.
The bass-rilief of Fig. 1 is chosen as the test object. The two partial views in the frames are shown in the OPL_Align environment in Fig. 2, where it is also evidenced the common region used to perform the alignment. The top figure in Fig. 3 shows the relative position between the two patches (Vista 1 and Vista 2 respectively) is shown before and after the alignment. The bottom figure in Fig. 3 shows the performance of the alignment.
Fig. 3 - Relative position between the two patches (top), performances of alignment (bottom).
The work performed on the Ferrari presents a number of similarities with respect to the work performed on the Winged Victory: it included the 3D optical digitization of the car, and the generation of a number of polygonal and CAD models.
Fig. 1 shows a view of the whole point cloud obtained by aligning and merging 280 partial pointclouds. The step has been performed with the help of suitable markers placed on the surface, given the dramatic regularity of the shapes, and the need to keep the alignment error as lower as possible. Moreover, a skeleton of few, large views (550 x 480 mm), with height resolution of 0.2 mm and measurement variability of 0.1 mm has been obtained in the first step. Then, smallerviews (370 x 300 mm), with resolution of 0.1 mm and measurement error of 0.06 mm, have been acquired and merged together using the skeleton as the reference.
Fig. 1 - Complete point cloud obtained after the alignment of the different views.
The multi-view alignment and the creation of the triangle model at high resolution have been performed by using the PolyWorks software. Then, the mesh has been saved in the STL format and imported into the Raindrop Geomagic Studio environment. Here, the triangles have been edited, topologically checked, and decimated at different levels of compression, mainly using only the automatic tools embedded in the software. Fig. 2 shows one of the most dense models obtained (1.5 million of triangles), while Fig. 3 depicts the model obtained after the compression of the previous one down to 10.000 triangles: despite the high compression here applied, the model presents a high level of adherence to the original measured data, thanks to the overall “smoothness” of the car surface.
Fig. 2 - Dense model obtained by the point cloud.
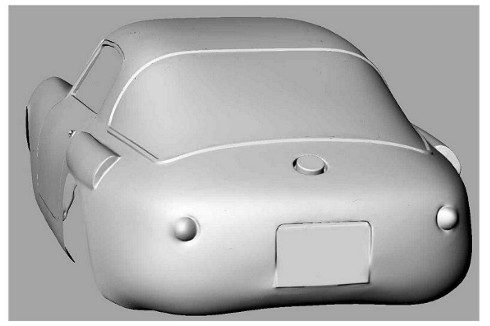
As the last step, the CAD model has been created starting from the triangle mesh of Fig. 2, with minimum intervention of the operator. Fig. 4 shows therendering of this model (theIGES format is used, resulting in a120 MBfile). The prototype of the car has been obtained at theLaboratory of Fast Prototyping of the University of Udine. The process involved thestereo lithography technique. Similarly to the prototyping of the head of the Winged Victory it resulted into the 1:10 scaled reproduction shown in Fig. 5.
Fig. 4 - CAD model obtained rendered by the software.
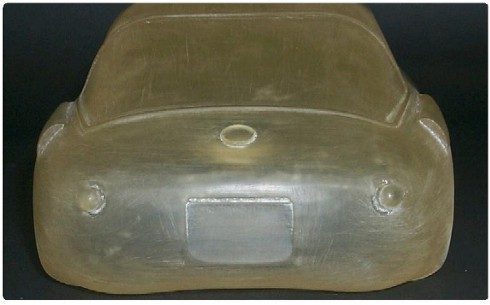
Fig. 5 - The prototype obtained by fast prototyping. Dimension: 370 x 150 x 90 mm; Material: CIBATOOL SL 5190.
The following sub-sections give an idea of the steps performed to carry out the project, and briefly present the results.
STEP 1: THE ACQUISITION OF THE POINT CLOUDS
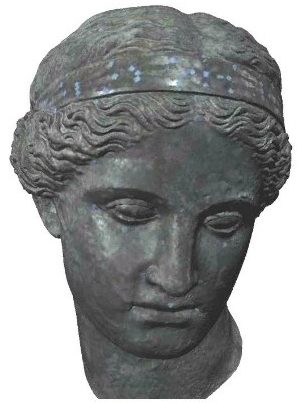
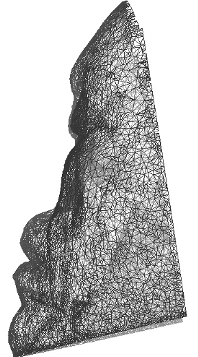
Fig. 1 shows the point clouds acquired in correspondence with the head of the statue. Following the requirement of the archaeologist staff, the digitizer has been configured to acquire at the highest resolution, even at the expense of a considerable number of views and of an increased complexity of the alignment process. In the figure, 41 views are shown after the alignment (performed in means of the PolyWorks IM_Align module). Each one is characterized by a lateral resolution of 0.2 mm, and a height resolution from 0.1 mm to 0.3 mm, depending on the quality of the measurement. The measurement error spans from 0.050 mm to 0.2 mm: this variability mainly depends on the colour of the surface and on the presence of numerous undercuts, holes, and shadow regions.
The body of the statue has been acquired at lower resolutions, depending on the different body segments. Special care has been taken to avoid misalignment between the views, especially considering that the registration process was very complex, due to the high number of point clouds (more than 500) needed to fully digitize the statue. The measurement was performed in two steps: in the former, the skeleton was acquired (few, large views at low resolution, along suitable paths around the statue), to minimize the alignment error. In the latter, a high number of small views was captured and aligned to the skeleton. At the end of the process, the skeleton was eliminated.
Fig. 1 - Point cloud obtained of the head of the statue, very dense of details.
STEP 2: THE CREATION OF THE TRIANGLE MODELS
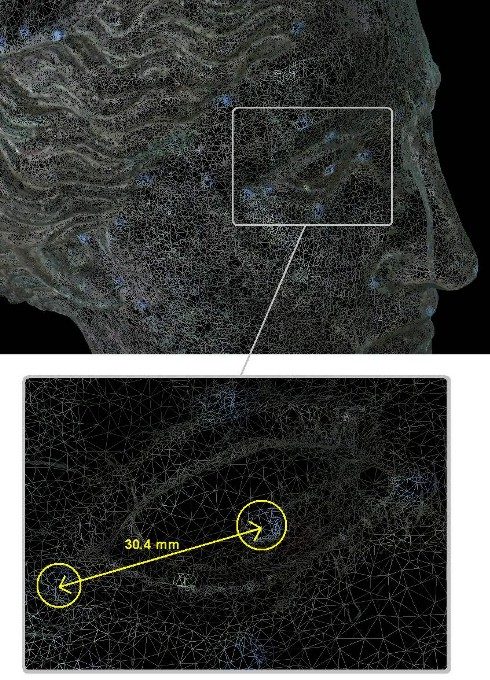
The IM_Merge module of Polyworks has been used to generate the polygon model from the measured data. Preliminarily, proper filtering, decimation and fusion of the partial views were carried out. Models characterized by different levels of adherence to the original point cloud have been created. Fig. 2 shows that one at the highest accuracy that has been used by the archaeologists to perform the measurements between the pairs of fiduciary points.
The measurement is very easy: the operator only selects on the display the two triangles representative of the fiduciary points and the software automatically evaluates and displays the corresponding distance. The measurement is very precise, due to (i) the high quality of the original data, (ii) the availability of the colour information acquired with the range data, and (iii) the density of the triangles within each single marker, as highlighted in the zoom of the figure.
Fig. 2 - High accuracy section of the head with a zoom of the eye. The measurment is very precise!
STEP 3: THE EDITING OF THE TRIANGLE MODELS
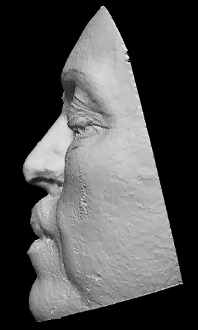
The Polyworks IM_Edit module was very useful for the editing of the triangle models. The objective was to eliminate holes, and in general all the topological irregularities deriving from the invalid measured data. As an example, Fig. 3 shows the appearance of the high-resolution triangle model of the head before the editing operation, while Fig. 4 shows the edited mesh obtained: it is easy to note how all the holes disappeared, resulting in a very appealing rendering of the surface. This model, when the colour information is added, as in Fig. 5, is suited also for applications different with respect to the original, metrological one. These are, for example, the virtual musealization of the statue, and the creation of a topologically closed STL model, that allows us the creation of the copy of the statue.
Fig. 5 - The head of the Winged Victory with the colour information added on top of the mesh.
STEP 4: THE CREATION OF SCALED REPRODUCTIONS OF THE STATUE
This step has resulted in the achievement of a number of copies of the Winged Victory. In Fig. 6 the 1:8 scaled copy of the head of the statue is shown. The work has been accomplished in the framework of the collaboration between our Laboratory and the Laboratory of Fast Prototyping of the University of Udine. A rapid prototyping machine has been used to produce the model, by means of the stereo lithography technique. The CIBATOOL SL 5190 has been used as the material. The overall dimension of the prototype is 140 x 110 x 133 mm. The memory occupation of the original STL file was 10MB: it has been sent via internet to the Laboratory located in Udine. The time required to obtain the copy was 0.20 hours for the elaboration of the data, plus 15 hours for the prototypization.
Fig. 6 - The prototyped models of the Winged Victory head, before and after the colour application on top.
A suite of copies of the whole statue has been obtained in the framework of the collaboration between the Direzione Civici Musei di Arte e Storia of Brescia and the EOS Electro Optical Systems GmbH, located in Munich, Germany. The work led to the development of two 1:1 scaled copies of the statue have been produced. For them, the Laboratory has provided the high resolution STL file shown in Fig. 7 (16 millions of triangles).
The model was segmented into sub-parts, that were separately prototyped. Fig. 8 shows the copy of the statue that is currently placed in the hall of EOS gmbh, Robert-Stirling-Ring 1, 82152 Krailling Munchen DE.
Further experimentation dealing with the generation of the mathematics of the surfaces has been carried out. Obviously, we did not want to “redesign” the shape of the statue: instead, the objective was to verify the feasibility of the generation of the CAD model of the surfaces, in view of its use mainly in two applications. The former is the reconstruction of lost parts (for example, the fingers of the hands), the latter is the virtual modification of the relative position of sub-parts of the body. For example, this is the case of the position of the head of the statue, which seems excessively inclined with respect to the bust.
Step 5: the creation of the CAD models
The feasibility study has been performed on the head. The Raindrop Geomagic Studio 3.1 has been used. The triangle models of these two body segments have been imported as STL files from the PolyWorks suite. The Geomagic environment elaborated them and generated the CAD model in three steps. The first one allowed the determination of the patch layout (in a fully automatic way); the second one automatically identified a proper number of control points within each patch, the third one fitted the NURBS surfaces to the control points. The following figures show the process in the case of the head of the statue. It is worth noting the regularity of the surfaces at the borders of each patch (Fig. 9), the complexity of the CAD model (Fig. 10) and the adherence of the mathematics to the triangle model (Fig. 11).
Fig. 11 - The adherence of the rendered model on the point cloud measured one is really good, as highlighted in the figure.
In this page, the application of the method to the case of nasal prosthetic reconstruction is shown. The patient suffered from a total loss of the nose, because of excision of a tumor. The optical 3D laser stripe digitizer Konica Minolta Vivid 910 was used to perform data acquisition. The system was mounted on a tripod and properly oriented to optimize the acquisition view point, as shown in Fig. 1. The whole face was scanned by a eye-safe laser stripe in 0.3 seconds. The corresponding point cloud is shown in Fig. 2.
By means of suitable tessellation, the raw 3D data point were replaced by triangle tessels that maintained the information about the contiguity of the points. The polygon mesh is shown in Fig. 3. A 4 mm thickness was then internally added. The mesh was then saved in a 9 MB STL file, for subsequent prototyping.
Fig. 3 – The triangles of the mesh: it is very dense and complex!
The “sculpured model” of the patient’s face was created. To this aim, a number of healthy “donors” were engaged. The Minolta digitizer was used to acquire at the best resolution the point cloud of their nose. Each mesh was dragged and roughly matched to the reference model, to visually appreciate the appearance of the whole face, and to select the most appealing shape, under the aesthetical point of view. After it was selected, it was carefully positioned onto the reference model. The boundaries were refined and finely blended to the deformity site, to optimize the functionality and the proportions of the prosthesis. The resulting sculpured model is shown in Fig. 4. A 4 mm thickness was externally added, the mesh was then saved in a 11.3 MB STL file.
Then, the physical models were created. Both the STL files were sent through the internet for the RP machining. They were fabricated using the epoxy photo-polymerizing resin “Somos Watershed 11120” by the SLA 3500 Prototyping Machine. The RP production was accomplished in about 14 hours. The two physical models are shown in Fig. 5.
Fig. 4 – Final model of the patient face with the reconstructed nose.
The last step was the fabrication of the prosthesis. The conventional wax positive pattern was cast. To perform this task, the two physical models were physically overlapped one to the other and the wax was poured as shown in Fig. 6. The wax pattern was then positioned on the prototype of the reference model as shown in Fig. 7. In this way, it was possible to perform the try-in of the prosthesis and its refinement on this copy, without disturbing the patient. The definitive prosthesis was obtained by conventional flasking and investing procedures. Fig. 8 shows the patient after the positioning of the prosthesis. It was then manually refined on the patient’s face, to match the skin color and texture. This operation was possible thanks to the collaboration with the medical team of the Faculty of Medicine of the University of Brescia and the precious contribution of Dr. Vincenzo Cavallari, technical specialist in facial and dental implants.