Performance Benchmark between an Embedded GPU and a FPGA

Nowadays is impossible to think of a device without considering it “intelligent” to some extent. If ten years ago “intelligent” systems where carefully designed and could only be used in specific cases (i. e. industry or defense or research), today smart sensors which are big as a button are everywhere, from cellphones to refrigerators, from vacuum cleaner to industrial machines.
If you think that’s it, you’re wrong: the future is tiny.

Embedded systems are more and more needed even in industries, because they’re capable to perform complex elaborations on board, sometimes comparable to the ones carried out by standard PCs. Small, portable, flexible and smart: it is not hard to understand why they’re more and more used!

A plethora of embedded systems is available on the market, according to the needs of the client. One important characteristic to check out is the capability of the embedded platform of choice to be “smart”, which nowadays means if it’s able to run a Deep Learning model with the same performances obtained while running it on a PC. The reason is that Deep Learning models require a lot of resources to perform well, and running them on CPUs usually means to lose accuracy and speed compared to running them on GPUs.

To solve this issue, some companies started to produce embedded platforms with GPUs on board. While the architecture of these systems is still different to the architecture of PCs, they are a quite good improvement on the matter. Another type of embedded systems is the FPGA: these platforms lead the market for a while before embedded GPUs became common, are low-level programmed and because of that are usually high performing.

In this thesis work, conducted in collaboration with Tattile, we performed a benchmark between the Nvidia Jetson TX2 embedded platform and the Xilinx FPGA Evaluation Board ZCU104.

STEP 1: Determine the BASELINE model

To perform our benchmark we selected an example model. We kept it simple by choosing the well-known VGG Net model, which we trained on a host machine equipped with a GPU on the standard dataset CIFAR-10. This dataset is composed by 10 classes of different objects (dogs, cats, airplanes, cars…) with standard image dimensions of 32×32 px.

The network was trained in Caffe for 40000 iterations, reaching an average accuracy of 86.1%. Note that the model obtained after this step is represented in floating point 32bit (FP32), which allows a refined and accurate representation of weights and activations.

Fig. 3 - CIFAR-10 dataset examples for each class.

STEP 2: Performances on Nvidia Jetson TX2

This board is equipped with a GPU, thus allowing a representation in floating point. Even if the FP32 representation is supported, we choose to perform a quantization procedure to reduce the representation complexity of the trained model to a FP16 representation. This choice was driven by the fact that the performances obtained with this representation are considered the best ones by the literature.

We used TensorRT, which is natively installed on the board, to perform the quantization procedure. After this process the model obtained an average accuracy of 85.8%.

STEP 3: Performances on Xilinx FPGA Zynq ZCU104

The FPGA do not support floating point representations. The toolbox used to modify the original model and adapt it for the board is a proprietary one, called DNNDK.

Two configurations were tested: a configuration where the original model was quantized from FP32 to INT8, thus losing the floating point and critically reduce the dimension of the network to few MB. The average accuracy obtained in this case is 86.6%, slightly better than the baseline probably because of the big representation gap, which in some cases lead to correct predictions the ones that were borderline between correct and incorrect.

The second configuration applies a pruning process after the quantization procedure, thus deleting useless layers. In this case the average accuracy reached is of 84.2%, as expected after the combination of both processes.

STEP 4: Performance benchmark of the boards

Finally we compared the performances obtained by the two boards when running inference in real-time. The results can be found in the presentation below: if you’re interested, feel free to download it!

The thesis document is also available on request.

Optical analysis of Trabecular structures

Rapid prototyping, known as 3D printing or Additive Manufacturing, is a process that allows the creation of 3D objects by depositing material layer by layer. The materials used vary: plastic polymers, metals, ceramics or glass, depending on the principle used by the machine for prototyping, such as the deposit of the molten material or the welding of dust particles of the material itself by means of high-power lasersThis technique allows the creation of particular objects of extreme complexity including the so-called “trabecular structures“, structures that have very advantageous mechanical and physical properties (Fig. 1). They are in fact lightweight structures and at the same time very resistant and these characteristics have led them, in recent years, to be increasingly studied and used in application areas such as biomedical and automotive research fields.

Despite the high flexibility of prototyping machines, the complexity of these structures often generates differences between the designed structure and the final result of 3D printing. It is therefore necessary to design and build measuring benches that can detect such differences. The study of these differences is the subject of a Progetto di Ricerca di Interesse Nazionale (PRIN Prot. 2015BNWJZT), which provides a multi-competence and multidisciplinary approach, through the collaboration of various universities: the University of Brescia, the University of Perugia, the Polytechnic University of Marche and the University of Messina

The aim of this thesis was to study the possible measurement set-ups involving both 2D and 3D vision. The solutions identified for the superficial dimensioning of the prototyped object (shown in Fig. 2) are:

  1. a 3D measurement set-up with a light profile sensor;
  2. a 2D measurement set-up with cameras, telecentric optics and collimated backlight.

In addition, a dimensional survey of the internal structure of the object was carried out thanks to to a tomographic scan of the structure made by a selected company.

Fig. 1 - Example of a Trabecular Structure.
Fig. 2 - The prototyped object studied in this thesis.

The 3D measurment set-up

The experimental set-up created involved a light profile sensor WENGLOR MLWL132. The object has been mounted on a micrometric slide to better perform the acquisitions (Fig. 3).
The point cloud is acquired by the sensor using a custom made LabView software. The whole object is scanned and the point cloud is then analyzed by using PolyWorks. Fig. 4 shows an example of acquisition, while Fig. 5 shows the errors between the point cloud obtained and the CAD model of the object.
Fig. 3 - 3D experimental set-up.
Fig. 4 - Example of acquisition using the light profile sensor.
Fig. 5 - Errors between the measured point cloud and the CAD model.

The 2D measurment set-up

The experimental set-up involving telecentric lenses is shown in Fig. 6. Telecentric lenses are fundamental to avoid camera distorsion especially when high resolution for low dimension measurments are required. The camera used is a iDS UI-1460SE, the telecentric lenses are an OPTO-ENGINEERING TC23036 and finally the retro-illuminator is an OPTO-ENGINEERING LTCLHP036-R (red light). In this set-up a spot was also dedicated to the calibration master required for the calibration of the camera.
The acquisitions obtained have some differences according to the use of the the retro-illuminator. Fig. 7, 8 and 9 show some examples of the acquisitions conducted.
Finally, the measured object was then compared to the tomography obtained from a selected company, resulting in the error map in Fig. 10.


Fig. 6 - 2D experimental set-up.
Fig. 10 - Error map obtained comparing the measured object to the tomography.

If you are interested in the project and want to read more about the procedure carried out in this thesis work, as well as the resulting measurments, download the presentation below.

Innovative, fast autofocusing system with liquid lens objective

Vision-based measurement techniques have become very important in the biomedical field, especially for macro applications such as fingerprints detection, retinal measurements and melanomas analysis. These applications usually require fast and accurate focusing systems to rapidly acquire the optimal image for the successive elaborations. Applications in macro regions also need a stable focus to systems that suffer from low frequency vibrations due to the natural oscillations of the human body.

Liquid lens objectives have become popular in the last years thanks to their small dimensions (apertures goes from 3 mm to 10 mm), low power consumption (less than 0.1 mW) and fast response time (about 15 ms) [1]. These characteristics make the liquid lens objectives suitable for autofocusing systems, which require high velocity, good accuracy and good stability. The high-speed control of liquid lens objectives requires smart algorithms for the autofocusing procedure, especially in macro regions.

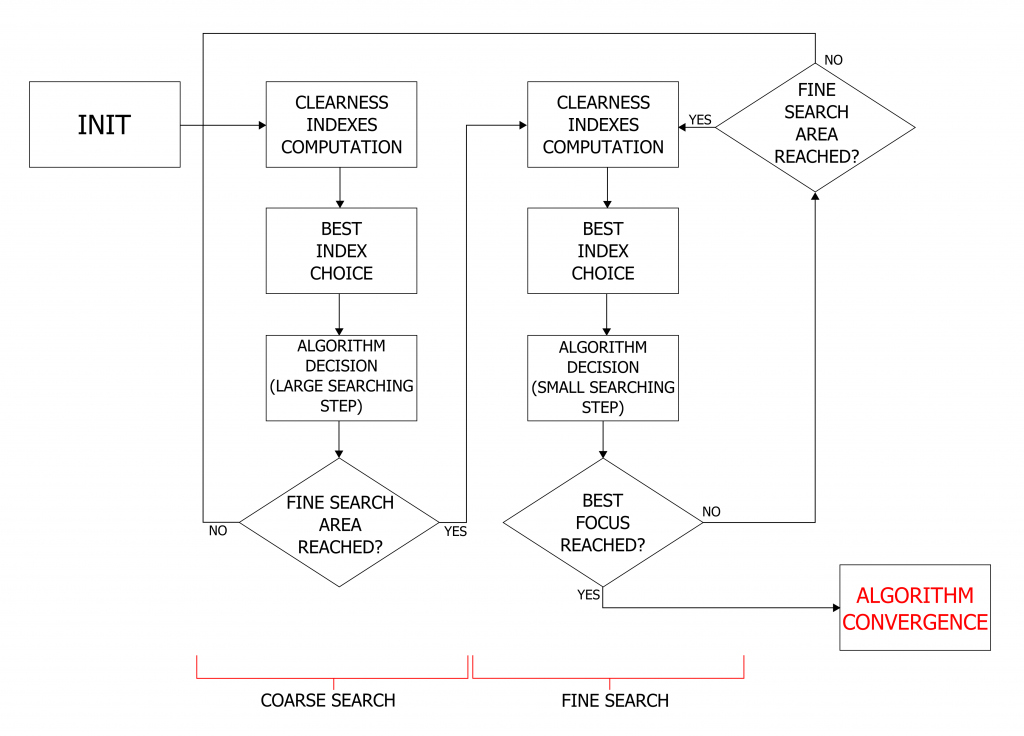
We developed a new system for biomedical macro applications. It uses a liquid lens objective, which implements a voltage control of the focal length, and an autofocus algorithm. The algorithm finds the best focus position using a two-stage search: a coarse searching and a fine searching. This approach combines high accuracy and high speed of convergence.

Figure 1 - Scheme of the autofocus algorithm.

The control variable of the algorithm is the clearness of the acquired image. Various indexes of clearness have been studied to implement the algorithm. Among these, two indexes have been selected, based on the absolute and on the squared values of the image derivatives respectively [2]. 

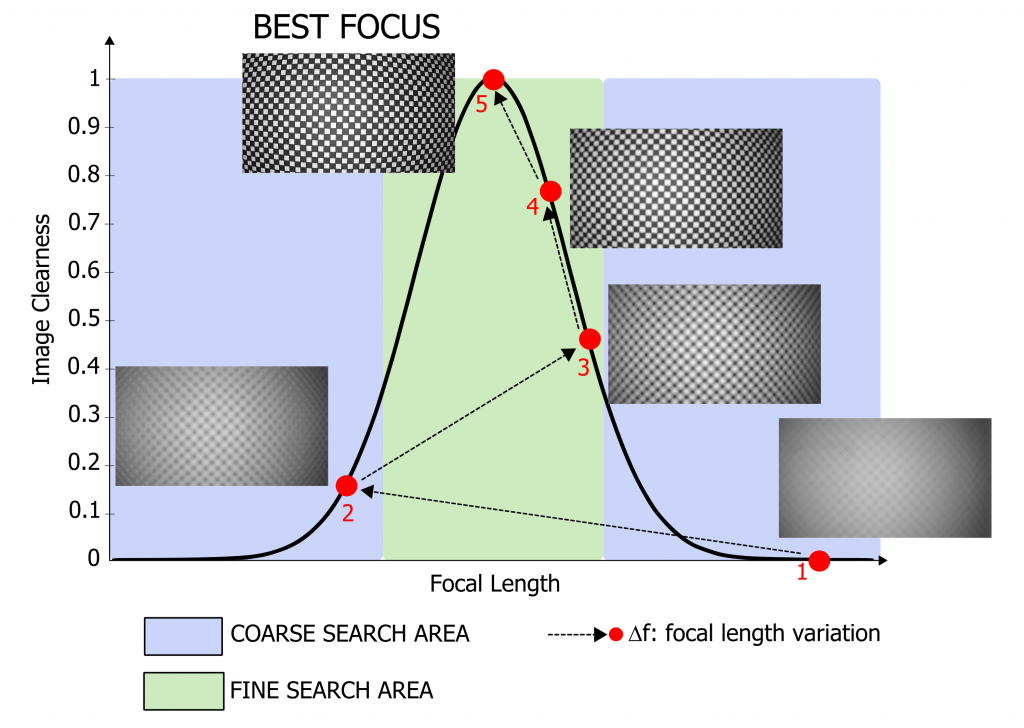
The black curve in figure 2 is the image clearness within the focal length range. The blue and the green areas represent the range in which the algorithm performs a coarse search and a fine search respectively. The red dots correspond to the values of clearness at different focal lengths, at each iteration of the algorithm. As a first step, a coarse search of the best focus position is carried out by varying the focal length from point (1) to subsequent points, until the green region is reached: in the figure, this process is performed in two steps, from point (1) to point (3). Then, the fine search is carried out: here, small increments of the focal length are considered, and the corresponding values of clearness are computed. A suitable threshold based algorithm is used to evaluate both the sign and the entity of the corresponding variations, and to choose the correct convergence direction. In the figure, this process is schematically represented by the path from point (3) to point (5), which corresponds to the best focus position.

Figure 2 - Algorithm approach using a template image.

The algorithm shows good performances in terms of speed of execution and accuracy and exhibits good results in real macro applications such as fingerprints, retinal and melanomas analysis. The algorithm has a good focus stability also with hand-held systems.

Related Publications

Pasinetti, S.; Bodini, I.; Sansoni, G.; Docchio, F.; Tinelli, M.; Lancini, M. “A fast autofocus setup using a liquid lens objective for in-focus imaging in the macro range“, AIP Conference Proceedings, Vol. 1740. 2016

Pasinetti, S.; Bodini, I.; Lancini, M.; Docchio, F.; Sansoni, G. “A Depth From Defocus Measurement System Using a Liquid Lens Objective for Extended Depth Range“, IEEE Transactions on Instrumentation and Measurement, Vol. 66, no. 3, pp. 441-450. 2017

Pasinetti, S.; Bodini, I.; Lancini, M.; Docchio, F.; Sansoni, G. “Experimental characterization of an autofocus algorithm based on liquid lens objective for in-focus imaging in the macro range“, 2017 7th IEEE International Workshop on Advances in Sensors and Interfaces (IWASI), pp. 195-200. 2017

Pasinetti, S.; Bodini, I.; Lancini, M.; Docchio, F.; Sansoni, G. “Automatic selection of focal lengths in a Depth From Defocus measurement system based on liquid lenses“, Optics and Lasers in Engineering, Vol. 96, pp. 68-74. 2017

Cosmic ray detection based measurement systems

Cosmic radiation has been known since the first decades of the 20th century: before the era of accelerators, cosmic rays have been considered, for decades, the best source of projectiles to investigate the core of matter, from nuclei to elementary particles.

Due to their property of crossing very thick and non-transparent materials, cosmic rays appear as suitable tools for the realization of measurement systems, especially as helpful alternative to traditional optical systems, when detectors are not mutually visible.

An example of application of cosmic rays to monuments monitoring is presented in this post: it has been developed in collaboration with the Istituto Nazionale di Fisica Nucleare (INFN) and the Department of Industrial and Mechanical Engineering of the University of Brescia.

Related Publications

Bodini, I.; Bonomi, G.; Cambiaghi, D.; Magalini, A. “Cosmic ray detection based measurement systems: a preliminary study”, Measurement Science and Technology, Vol. 18, pp. 3537-3546. 2007

Zenoni, A.; Bonomi, G.; Donzella, A.; Subieta, M.; Baronio, G.; Bodini, I.; Cambiaghi, D.; Lancini, M.; Vetturi, D.; Barnabà, O.; Fallavollita, F.; Nardò, R.; Riccardi, C.; Rossella, M.; Vitulo, P.; Zumerle, G. “Historical building stability monitoring by means of a cosmic ray tracking system”, Proceedings of 4th International Conference on Advancements in Nuclear Instrumentation Measurement Methods and their Applications (ANIMMA 2015). 2015